Key Takeaway: While the results of the UK vote and advisory referendum have prompted swift reaction in the financial markets, the political path forward is uncertain. Further, there should be no expectation of swift or perhaps even clear resolution. However, history suggests that stocks tend to rebound quickly from market events-related selling. Herein, we will look beyond just the popular stock market averages for evidence that healing is taking place.
Brexit news and discussion continue to dominate the headlines. There is increasing speculation that the results of the non-binding referendum could be ignored outright (preserving the United Kingdom may take political precedence over splitting from the EU) or that last week’s vote might just mark another milestone in a long and drawn-out process. The path forward at this point is unknown, but we would not be holding our breath expecting a swift and decisive resolution.
The financial market response has been swift (although the S&P 500 Index remains largely within the bounds of its recent range). The good news for investors is that “crisis” market events like this are not that rare, and the initial weakness tends not to persist. Ned Davis Research has amassed a list of more than 50 such market events over the course of the past century-plus. While stocks have tended to be down sharply in the wake of a market event (a median decline of 2.9% and an average decline of 6.7%), stocks have quickly rebounded, seeing on average a 5% rally after three months and a 9% gain after six months. On a median basis, the weakness seen during market events was totally reversed within a month.
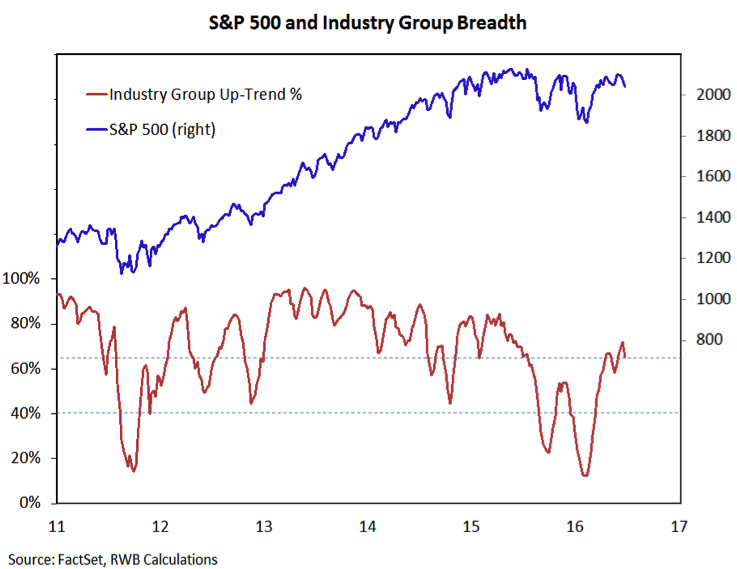
Strong market breadth and a lack of widespread investor optimism coming into this current weakness argue that downside could again be limited for the stock market. We will keep close tabs on those indicators moving forward (so far, market breadth has held up and we are seeing evidence of increased investor pessimism). The reaction to the UK vote was not just limited to stocks, and so we will also look to the currency and bond markets for evidence that the expected healing is taking place.
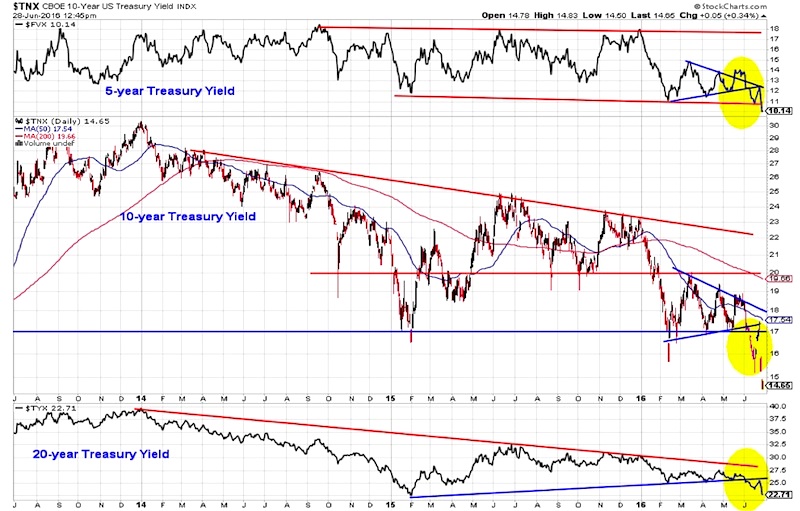
Bond yields collapsed as investors have sought safe havens in which to ride out this storm. The bond yield on the 10-year T-Note has dropped below 1.50% in the wake of this decision (and at a time when domestic inflation is showing signs of ticking higher). If the market is indeed starting to look beyond the headlines, we could see movement towards 1.7% on the 10-year (and 2.5% on the 20-year).
5, 10, 30 Year – U.S. Treasury Yields Chart
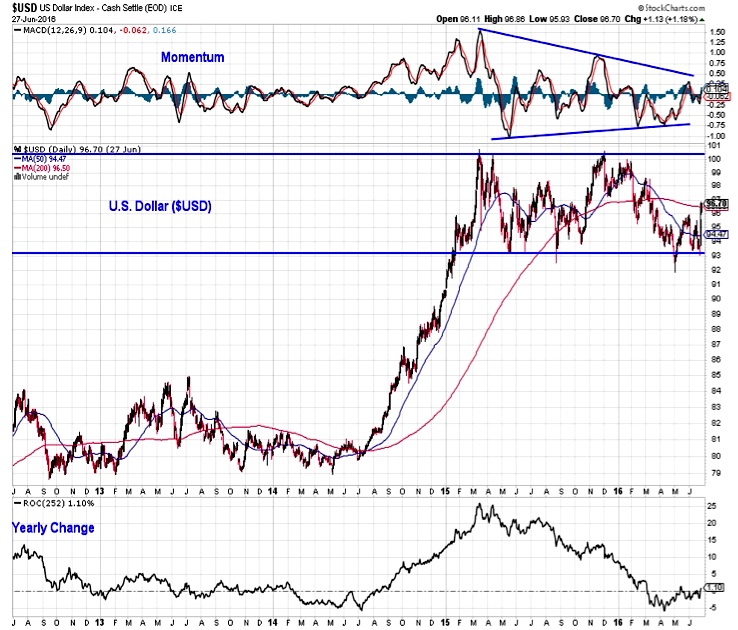
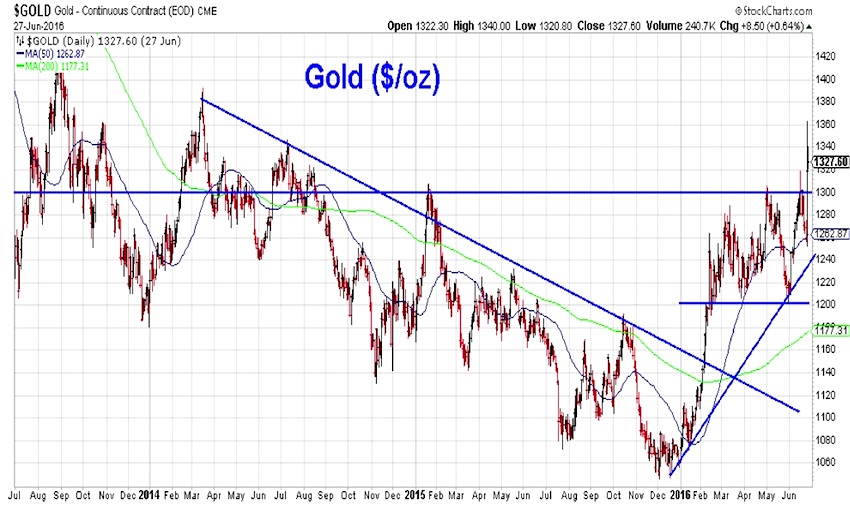
The currency markets have seen some of the most dramatic reactions over the past few trading sessions. Rather than moving into the many available currency-pairs, we would instead focus on the dollar, and also keep an eye on gold. The dollar has risen to its highest level since March, but it is only near the mid-point of the range that has persisted for a year and a half. Gold has also spiked as investors have sought out a hedge against currency volatility in general. After being range bound between $1200/oz and $1300/oz for much of the first half, gold prices surged as high as $1360/oz. It has already started to give up some of that initial move. A cross back below $1300/oz would, like weakness in the dollar, suggest that the panic associated with the Brexit results is fading.
US Dollar Index Chart
Gold Chart
Thanks for reading.
Twitter: @WillieDelwiche
Any opinions expressed herein are solely those of the author, and do not in any way represent the views or opinions of any other person or entity.

: Worrisome to Broader Market?")

