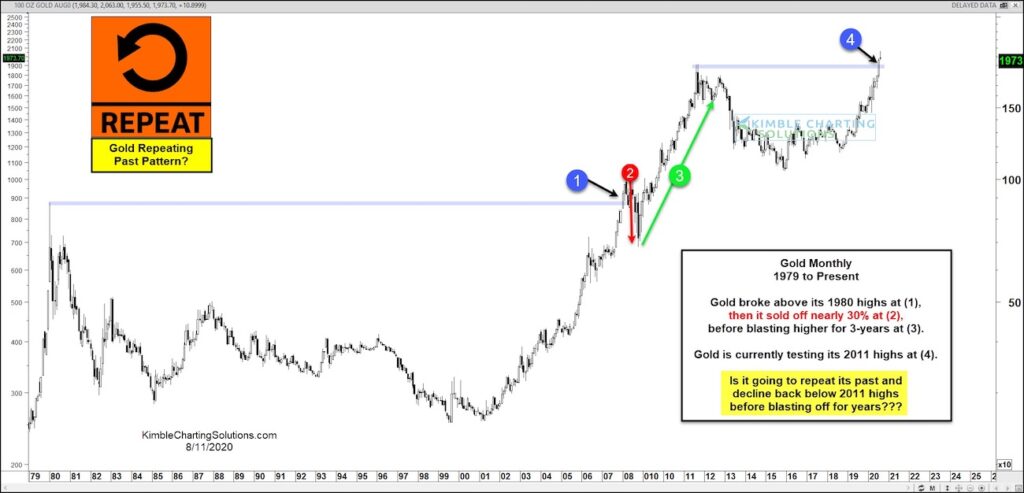
Gold “monthly” Price Chart
Over a decade ago, Gold rallied past its 1980 highs and over $1000/oz at (1) on today’s chart.
That rise to new highs was met with a 30 percent correction at (2), followed by a blast off rally to new highs.
Is gold setting up for a repeat of its past?
Gold recently rallied past its 2011 highs and above $2000/oz. Could Gold soon turn lower for a sharp correction before another blast off toward $3000?
If so, Gold bulls should look for a pullback, before blasting higher. Stay tuned!
Note that KimbleCharting is offering a 2 week Free trial to See It Market readers. Just send me an email to services@kimblechartingsolutions.com for details to get set up.
Twitter: @KimbleCharting
Any opinions expressed herein are solely those of the author, and do not in any way represent the views or opinions of any other person or entity.


: Showing Some Signs of Emerging Strength")
