This post was written with Craig Basinger of Richardson GMP.
Earlier this week the VIX Volatility Index (INDEXCBOE:VIX,), which measures U.S. equity market volatility, moved below 10. Crazy, eh?
The VIX measures the implied market volatility being priced into a basket of call and put options on the S&P 500. Or, you can simply think of it as expected market volatility, based on the cost of options. Dropping below 10 has only occurred a few times in the history of the VIX that dates back to 1990. It happened in 1993, late 2006 / early 2007 and now in 2017 (chart below). We could provide a narrative as to why the VIX is low. Perhaps too much liquidity in the market is supressing volatility (vol). Still sub 10 is very rare and worth noting.
The good news is that while a very high VIX is often viewed as a buying opportunity, the opposite is not necessarily true. Volatility can remain depressed or below the historical average for an extended period of time. And during these times, the markets often march higher. Following 1993 when the VIX dipped below 10, we saw markets march higher for the next seven years. Conversely, early 2007 would have been a good exit point. Worth noting, the VIX brushed against the 10 level many times from 2004 till 2007, as markets enjoyed a strong advance.
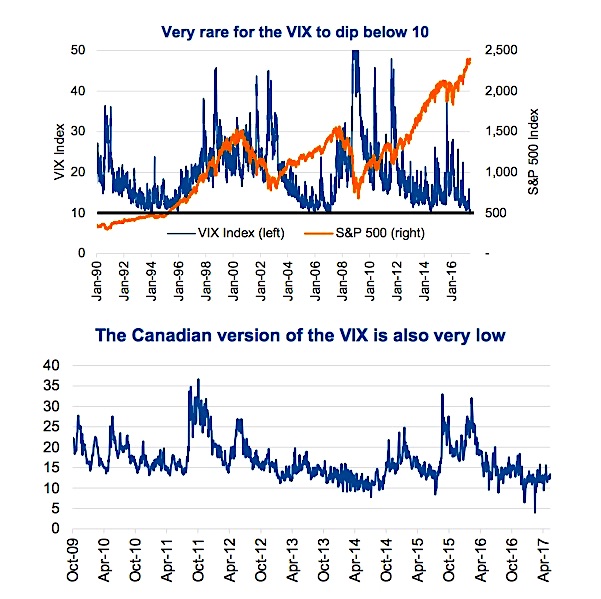
Canada also has a VIX measurement, based on TSX 60 options. It does have some weird pricing on occasion, likely due to our fragmented options market. But generally speaking the Toronto VIX (TVIX) appears to be at, or near the bottom end of its range. This got us wondering whether it was really capturing the volatility of the market. In the past two weeks we have seen some fairly big price moves. Home Capital fell 60% in one week, Aimia is down 55% this week. These are unique situations, but the market just felt more volatile than the TVIX was showing. So we did some more digging.
A 2 sigma event is when volatility is more than 2 standard deviations away from its mean (average). If returns were normally distributed, a 2 sigma event would occur 5% of the time, a 3 sigma event 1% of the time and a 4 sigma event almost never. We used weekly data and a 55% drop in a stock like Aimia is even bigger than a 4 sigma. In fact, it is around 9 or 10 deviations away which should only occur every few billion years. That was fun, but spoiler, stock returns are not normally distributed, so it muddles things. It is still a useful exercise to look at a company’s historical volatility and see where they sit today.
We gave a 2 Sigma event a score of 1, a 3 Sigma event a 2 and a 4 Sigma event or larger a score of 3. Doing this based on weekly data for all TSX Composite members, we may be right in our gut feel, things have been more volatile over the past few weeks. This week’s total is 19, the highest so far this year (top chart below).
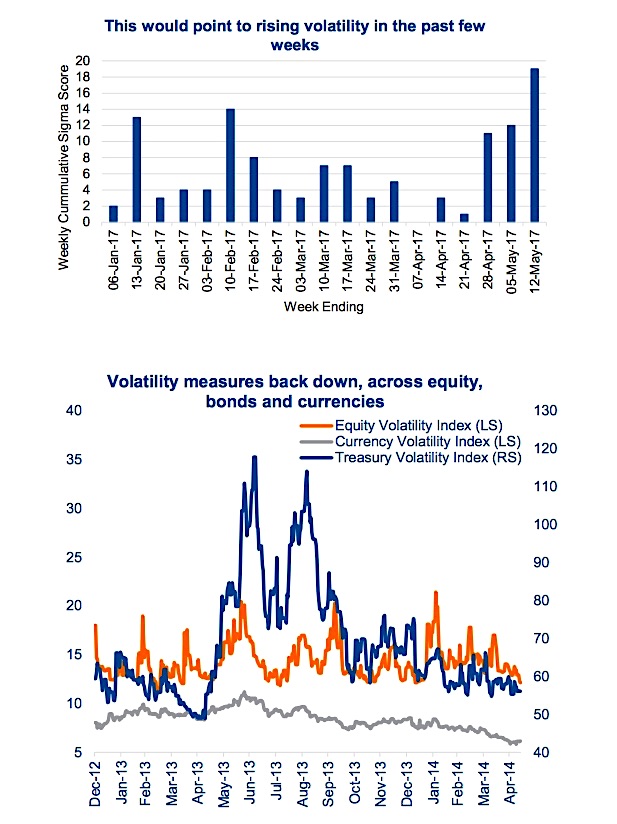
Volatility Measures Falling Across Asset Classes
It isn’t just the equity volatility measures that have declined in the past few months. The lower chart above includes the VIX for equities and similar measures for the bond and currency markets. Volatility has been sucked out of the market and measures are now down to some of the lowest readings over the past few years in various asset classes.
Investment Implications
Low volatility measures do not spell pending doom or are not necessarily a precursor for a resurgence in volatility. However, as other measures are pointing to higher underlying volatility such as our sigma score, we would not be surprised to see these depressed vol levels give way to higher levels. Not to mention the market has been very resilient to political risk which may be under-priced based on current levels. If you were inclined to purchase portfolio insurance, this could prove an opportune time.
Thanks for reading.
Charts are sourced to Bloomberg unless otherwise noted.
Twitter: @sobata416 @ConnectedWealth
Any opinions expressed herein are solely those of the authors, and do not in any way represent the views or opinions of any other person or entity.


