In the spring of 2020, I highlighted the potential for a very bullish long-term pattern for Gold.
That pattern was the popular “cup with handle” formation. At that time, it was still attempting to fill out the right side of the “cup” formation.
Today, we take another look at the “monthly” chart of gold and get an update on that pattern.
Gold “Cup With Handle” Formation Eyes $3000 Price Target?
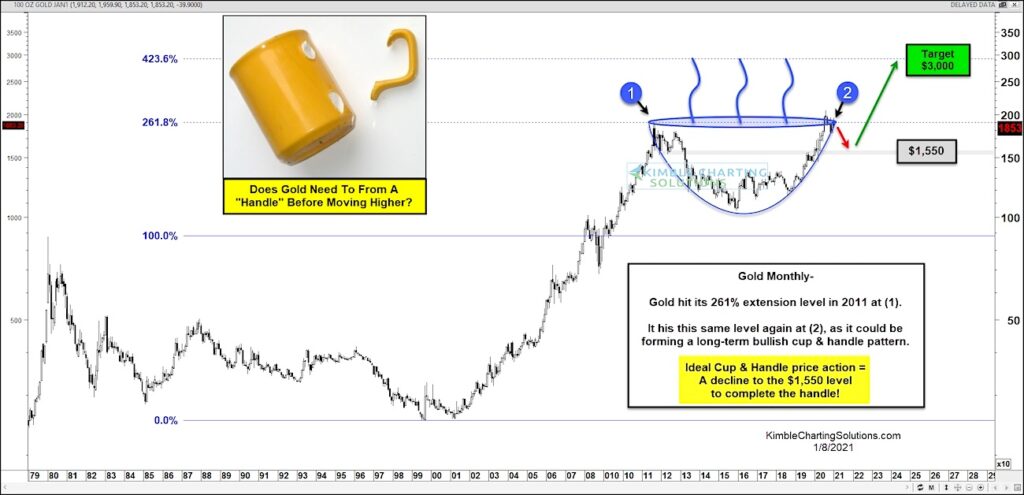
As you can see in today’s chart, Gold has completed the “cup” pattern and is currently pulling back into what could be the “handle” part of the formation. Ideally, Gold bulls want to see a decline down to the $1550-$1600 level before another big rally begins.
As we noted back in the spring of 2020, the Fibonacci symmetry of this cup formation is very intriguing. Gold peaked at its 261% Fibonacci extension price level in 2011 at (1) and again in 2020 at (2) – this formed the “cup”. And a pullback into the 38.2% Fibonacci of the “cup” formation would be an ideal spot for the “handle” to form.
Does Gold need to form a “handle” before moving higher? Not necessarily… but it sure would help Gold get to $3000 a lot sooner. Stay tuned!
Gold “monthly” Price Chart

Note that KimbleCharting is offering a 2 week Free trial to See It Market readers. Just send me an email to services@kimblechartingsolutions.com for details to get set up.
Twitter: @KimbleCharting
Any opinions expressed herein are solely those of the author, and do not in any way represent the views or opinions of any other person or entity.


