Have you ever looked at the stock market this way?
I’ll explain it after I explain why I’m showing this image to you now.
This may be different, but the perspective is powerful in understanding the condition of the stock market, and in managing the emotional rollercoaster that big up days (like today) can cause.
More specifically, when there is a big up day, and it’s only the second day after a very negative day (i.e., IWM breaking its June low) it’s very easy to feel frustrated.
Maybe you got stopped out near the lows.
Or maybe you simply didn’t get in at the right time (on the close last Friday) and missed the big 2-day move up.
As a result, you’re frustrated.
Don’t be.
This is when a healthy dose of perspective is needed.
It’s been a nice 2-day rally in all four of the major indexes (DIA, SPY, QQQ, and IWM).
However, the same sort of rally happened almost a week ago when the markets had just run up for two days off the remarkable August low.
If you bought that market bounce, then you would have had the unpleasant experience of riding that elevator all the way back to where it started (and them some in the DIA and IWM) in every index but the QQQ.
Or worse, maybe you enjoyed today’s bounce because you’ve been long since before the selloff began in August.
In this case, you’re happy to have caught the bounce, but you probably feel more like you just ‘caught a break.’ The one you’ve been feeling like you can’t seem to catch all month.
If on the other hand, you did catch the 2-day move and you’re feeling like a genius, then here too…
This is when a healthy dose of perspective is needed.
If you’re an MMMA member and following my trades in AAPL and SMH, you know where I’m going with this, but hopefully, the image will make it more clear and more applicable for your trading in the future.
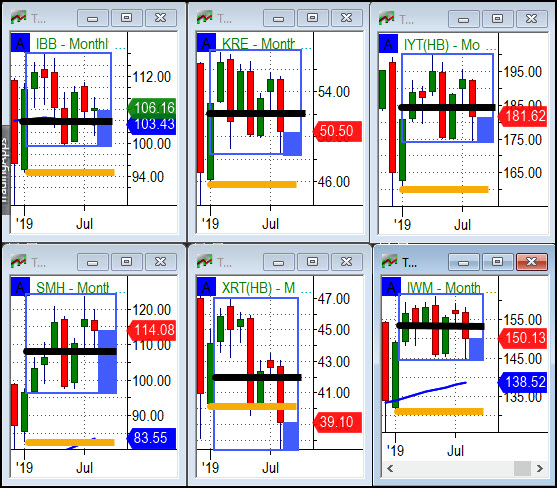
The image is the Modern Family monthly candles for 2019.
The blue box surrounds the range for all months other than January. I excluded January because my feeling is that January just got back what December 2018 took away.
And because if you look at the markets in this box, you can see that it does a very good job and describing what has really happened this year – a lot of consolidation.
Consolidation is not what most people would think when you tell them that the ‘market’ was up 20% for the year, but what do you see in the blue boxes?
Next there is a solid blue box in the lower right corner. This is simply a visual level marking the distance from the bottom of the blue box (the Feb-Aug. range).
As you can see, in the context of where the market has really been trading this year, all but one of the Family Members are still near the bottom of the range.
Put another way, even after the nice 2-day rally, you haven’t really missed much.
The black line is the low of July.
In our advanced levels (the Complete Trader) we teach the significance of markets breaking below their July range. It’s not always the low of the months, but this year it worked out that way.
In short, especially during a bullish year, breaking below the July range can be a catalyst. If you look at the daily charts, you’ll see how uncanny this proved to be at predicting the market’s breaking point.
Now, the black line is an important level for the bulls to overcome. And as a matter of perspective, if you waited for that to get bullish, you’d still be in the lower half of the big blue box.
Again, you haven’t missed much.
Finally, there is an orange line which is the low of the year. It’s January in all 6 charts.
It’s not good to trade under July, but it’s even worse to trade under January.
I’ve stated this many times in Mish’s Daily as XRT, a proxy for the consumer, has made its way below this level.
At the same time, the Modern Family has been well defined by the blue box.
By seeing that the markets were beaten down to levels of support, it was a reasonable bet that any reprieve from the negative news flow would lead to a pop in price.
It’s like selling an option knowing that time is on your side.
For the trader interested in betting that the blue box will hold, you can buy the bounce with short-term trading tactics and be prepared to get stopped out.
My preference in doing this is buying stocks or ETFs with good phase setups, and/or Triple Play or Real Motion conditions (or all three)
This is why in MMMA I suggested AAPL and SMH after the first turn up.
I was early, and too quick to move up my stop in AAPL, and as a result, on the subsequent retracement I stopped out for reasons I explained to MMMA members.
SMH on the other hand is now the strongest picture on the board, and we got in near the low. With any luck we won’t have to content with exiting anytime soon.
There are several messages here.
- Trying to catch the last 2-day bounce was only a good bet from the standpoint of seeing the potential upside vs. the location of a good stop.
More importantly, I wouldn’t play for the 2-day bounce. My experience has been that I’ll get stopped out of a lot of trades like this. So I need a few of them to turn into big winners to make the $ and emotional rollercoaster worth it. Don’t get out too early. - Missing the 2-day bounce is a probably a good thing if you didn’t try to pick the bottom.
In baseball they call this “waiting for your pitch.” It only takes one good pitch (setup) to hit a home run. And while you wait for your pitch, you can be wrong in watching 2 good ones get away, and you can even let 4 misleading opportunities go and you get rewarded with a free base.
You just need to hit the one that you can make count. The same is even more true in trading. Be patient and deliberate. - You don’t want to buy anything under January’s low.
- The Modern Family is not running away without you, so there will be plenty of opportunity (preferably either over the black line or closer to the bottom of the blue box range).
- You’re not a genius if you bought against the low, nor are you a bad trader if you didn’t.
- If you took the time to read all the way to this last point, you have what it takes to be a successful trader, or you’re already a very successful trader.
Important Stock Market ETF Levels:
S&P 500 (SPY) Support at today’s lows, 291.44 then Friday’s high, 289.33 Resistance at 50-DMA and swing high area, 294.
Russell 2000 (IWM) Stopped at the 200 DMA.Support around today’s low, 150 and then at Friday’s high 148.91.Resistance at 200 DMA, 151 then 152.70.
Dow Jones Industrials (DIA) I’d just focus on range low, 254 and range high 264.60.
Nasdaq (QQQ) Support area at today’s low, 187.50, then gap fill at 186. Resistance at swing high, 189.70.
KRE (Regional Banks) Support around 50. Resistance at the range high at 51.70 then 51.50.
SMH (Semiconductors) Closed over the range high. Support at today’s low, 133.55 then gap fill at 110.Resistance at 116, then 120.
IYT (Transportation) Support at pivotal area, 180. Resistance 186 then 191.
IBB (Biotechnology) Sitting just under the 200 DMA. Support at 104. Looks interesting if it can close over 107.
XRT (Retail) Support at 38.75, then swing low 37.46. Major resistance around 41.30.
Twitter: @marketminute
The author may have a position in the mentioned securities at the time of publication. Any opinions expressed herein are solely those of the author, and do not in any way represent the views or opinions of any other person or entity.


