This summer for the first time in years, our trumpet vines are in full bloom!
And what a happy sight that is.
Hummingbirds love them.
They add a delicious slab of color against our drab coyote fence.
And, they remind me of the 100-year low ratio between equities and commodities.
Last night I featured the US Commodity Index ETF NYSEARCA: USCI in my “daily” column.

With only 55,000 shares traded a day, the instrument is thin.
Noteworthy though, is that today’s volume was 169,000 or more than 3 times the average!
Also important, after making a double bottom at the all-time lows at 34.59, today it rallied nearly 1.5% clearing all the price action since August 2nd.
Like our rare and prolific tulip vine blooms suggest, could the season be wet enough to finally buy commodities?
One factor which “waters” commodities is interest rates. With yields low and TLTs flying, the environment is more fertile for commodities.
Nevertheless, the strength in the US dollar, coupled with slowing global growth and fears of recession, (not to mention tariffs), are a big reason why the low yields have not really produced higher commodity prices.
Unless of course, you are looking at gold, silver and the miners.
Can moves like the recent one we have seen in the metals be a standalone move?
Or, can we consider the possibilty it’s an early head’s up that the other soft commodities will follow in kind?
If tulip vines attract hummingbirds, will the metal rally attract buyers to say, sugar or grains?
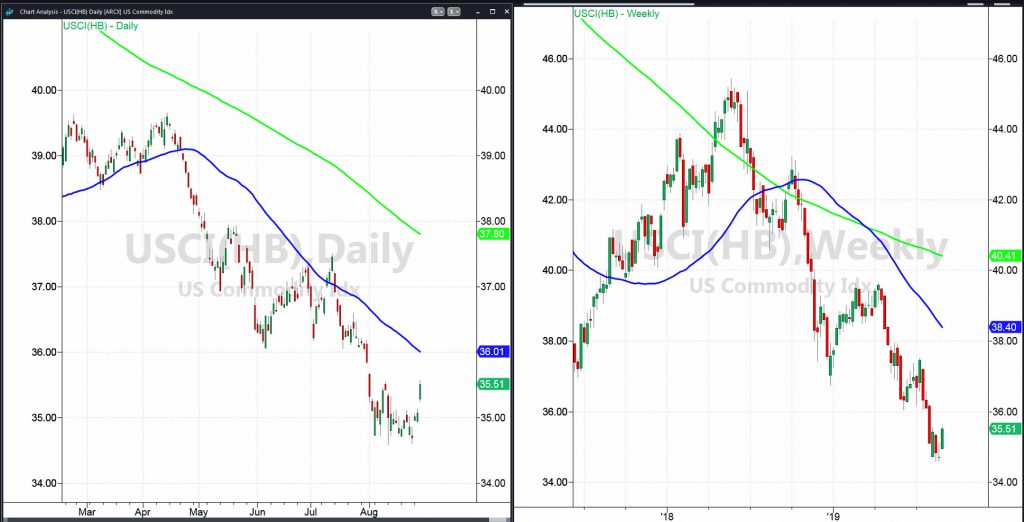
I show you 2 timeframes of USCI.
The Daily chart shows the potential double bottom at 34.59 and 34.60.
It also shows the impressive move off the lows we had today after the gap open higher.
The Weekly chart shows the move off the lows as well, with a clearer picture of the resistance at 36.00, which held as support until 5 weeks ago or the week of August 2nd.
What we want to see now is for USCI to hold the recent lows, close the week out above 35.55, and then clear 36.00, which is also the 50-DMA.
What would be super impressive, is if USCI gaps over 35.66, the August 1sthigh and leaves a substantial island bottom formation.
Like 2 sides of a coin, not everyone loves tulip vines, just like not everyone will want to see a rally in commodity prices.
Some say that trumpet vines are insidious.
The flowers form seeds that drop to the ground, making more vines that do the same thing. Even more sinister are its spreading roots that submarine underground far from the original plant and pop up suckers everywhere. Fighting rampant trumpet vines is a war you can’t win without herbicide.
Should this really be the bottom in commodities, fighting the potential for rampant inflation is a war that will put the Federal Reserve without the ability to offer its version of herbicide-keeping yields low to stave off a bear market in equities.
S&P 500 (SPY) Big range from 280-290 must reconcile.
Russell 2000 (IWM) 148.25 resistance with nothing terribly exciting unless it clears 152-153. Downside key support at 145 then 140.00
Dow Jones Industrials (DIA) 263 key resistance and 256 very key support.
Nasdaq (QQQ) 2 inside weeks. 176.75 huge support with 189 point to clear.
KRE (Regional Banks) 46.23 is the monthly MA support-49.25 immediate resistance to clear.
SMH (Semiconductors) Resistance at 115.75. 112.70 pivotal and 106.75 support.
IYT (Transportation) Under 175 more trouble. Over 179 better.
IBB (Biotechnology) The 200 WMA at 102.71 pivotal.
XRT (Retail) Under 37.80 more trouble-over 40 better.
Twitter: @marketminute
The author may have a position in the mentioned securities at the time of publication. Any opinions expressed herein are solely those of the author, and do not in any way represent the views or opinions of any other person or entity.

: Worrisome to Broader Market?")

