Housing and home building related stocks have been hit hard over the past year.
Case in point: The Homebuilders ETF (NYSEARCA: XHB).
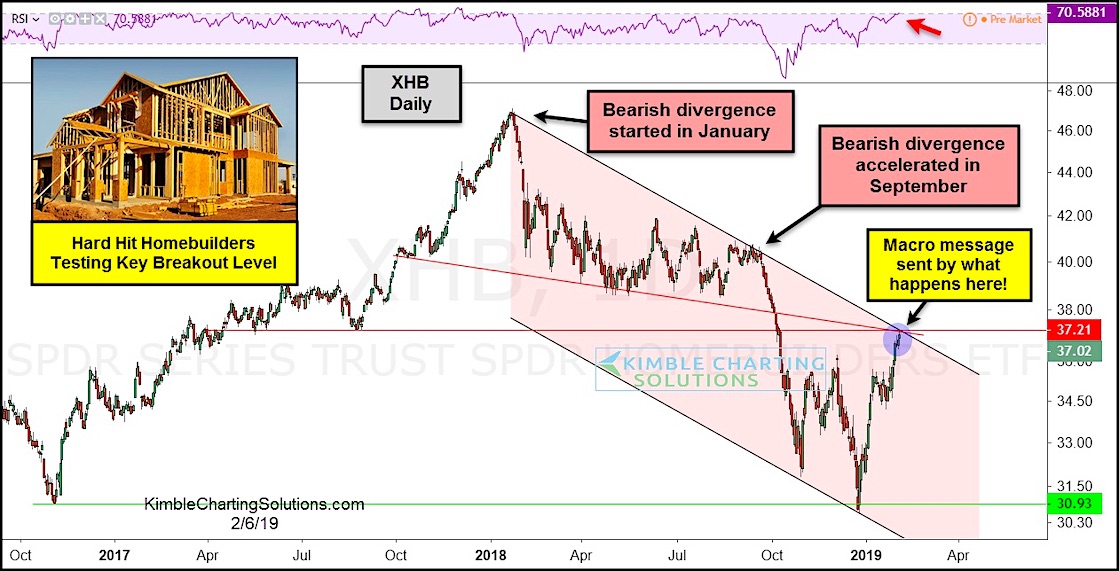
Looking at the chart below, it’s clear that the Homebuilders (XHB) have been in a downtrend since last January of last year (see pink shaded area).
The downtrend started with a bearish divergence and accelerated with another bearish divergence in September of last year. This lead to the December lows.
The current rally has carried XHB up into a critical breakout level. This level is made up of a key confluence of lateral and trend line resistance.
What happens here will send an important message about the economy to the stock market.
The bullish case for the economy and stocks is a breakout here. BUT the bullish case will receive a concerning canary message if heavy selling takes place at this key resistance level.
Homebuilders (XHB) “daily” Chart
Note that KimbleCharting is offering a 2 week Free trial to See It Market readers. Just send me an email to services@kimblechartingsolutions.com for details to get set up.
Twitter: @KimbleCharting
Any opinions expressed herein are solely those of the author, and do not in any way represent the views or opinions of any other person or entity.


: Showing Some Signs of Emerging Strength")
