The broad stock market indexes have been contained for the better part of the past 18 months.
There’s a good reason for this rangebound price action – just look under the surface. Internal indicators like market breadth and momentum have recorded (non-confirmation) divergences along the way.
This means the market isn’t in sync. As well, we are seeing ratio charts that reflect this as well. And that’s the subject of today’s 3-pack of charts below.
Ratio weakness mean anything?
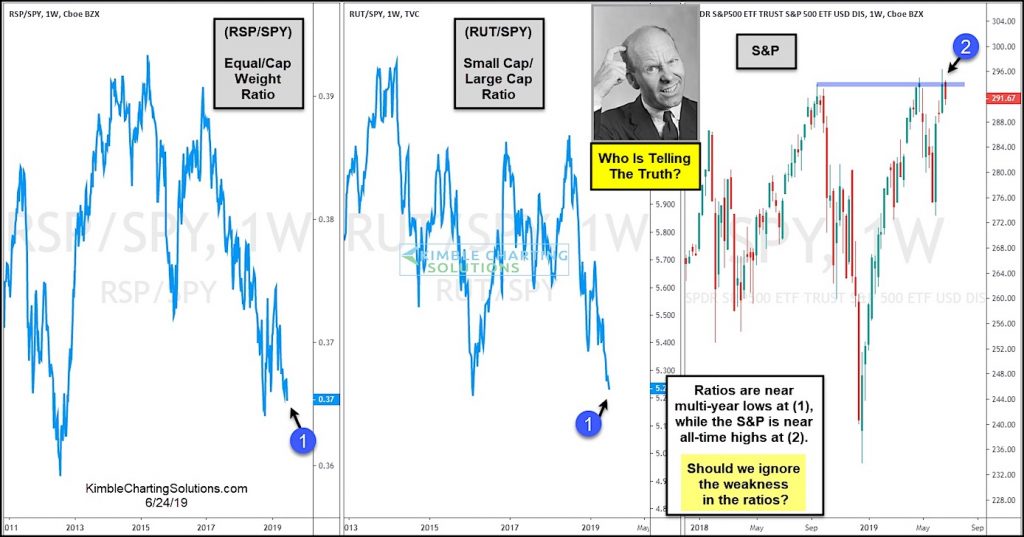
In the chart below, we highlight two ratio charts and compare them to the S&P 500 Index.
In the first chart (on the left), we have the Equal Weight vs Cap Weight ratio chart and that is followed by the Russell 2000 small cap Index vs S&P 500 large cap Index ratio (in the middle).
Both of these charts are experiencing severe weakness at (1) while the S&P 500 is trying to breakout at (2).
It’s hard for the broader market to breakout if these ratios remain weak.
So bulls really need these ratios to turn higher for any breakout to stick. Stay tuned!
Equal Weight vs Cap Weight and Small vs Large Caps – Ratio Weakness!
Note that KimbleCharting is offering a 2 week Free trial to See It Market readers. Just send me an email to services@kimblechartingsolutions.com for details to get set up.
Twitter: @KimbleCharting
Any opinions expressed herein are solely those of the author, and do not in any way represent the views or opinions of any other person or entity.


