 By Sheldon McIntyre
In late September, I wrote a post highlighting the improving short-term outlook for the Shanghai Stock Exchange Index (SSEC).
Below are three key points that set off my bullish view.
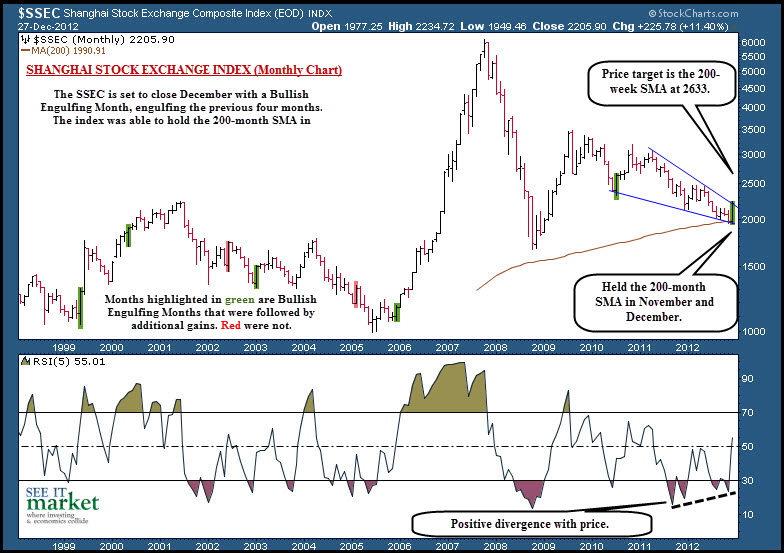
- On the monthly chart there was a positive divergence between price and RS at the lows.
- The price deviation from the mean (200-week SMA) was extreme at over 30%.
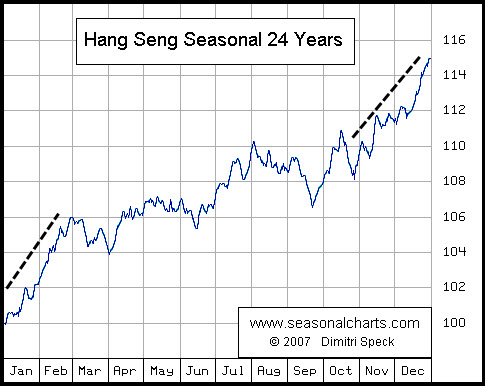
- The Hang Seng seasonality chart was bullish heading into year-end.
Since that post the probability of a strong rally has increased with the SSEC set to close with a Bullish Engulfing Month in December after finding support at the 200-month SMA. In the September post I wrote that “once an index stabilizes at or near the 200-month SMA there is a high probability that it will begin a bear market rally that will top near the declining 200-week SMA.” You will also note on the monthly chart below that a Bullish Engulfing Month has often preceded a rally or confirmed the continuation of a rally. Click chart to enlarge
The Hang Seng seasonality chart remains bullish into the end February. See below
If the SSEC can trade above the highs of December in the New Year it should confirm a rally to the 200-week SMA (a 20% gain). I view the potential move as a bear market rally and should be followed by another decline to the 200-month SMA or more. For the record, I don’t see a new all-time for the SSEC for years. Why? For example, at the peak of the parabolic move in 2007 the SSEC was about 220% from the 200-week SMA (mean). In 1929, the Dow Jones peaked at 83% above its 200-week SMA and in 1987 it was 72%. In 1989 the Japanese Nikkei peaked at 51%. In 2000 the NASDAQ 100 peaked at 150% and the Semiconductor Index (SOX) at 200%. The Nikkei, NASDAQ 100 and the SOX still have not revisited those highs. In the case of the Dow, it took over 20 years to trade above the 1929 high.
At this point, everything points to a bear market rally for the SSEC in the first half of 2013. If it doesn’t materialize as described it would point to much lower prices for the index.
Twitter: @hertcapital @seeitmarket
No position in any of the securities mentioned at the time of publication.


