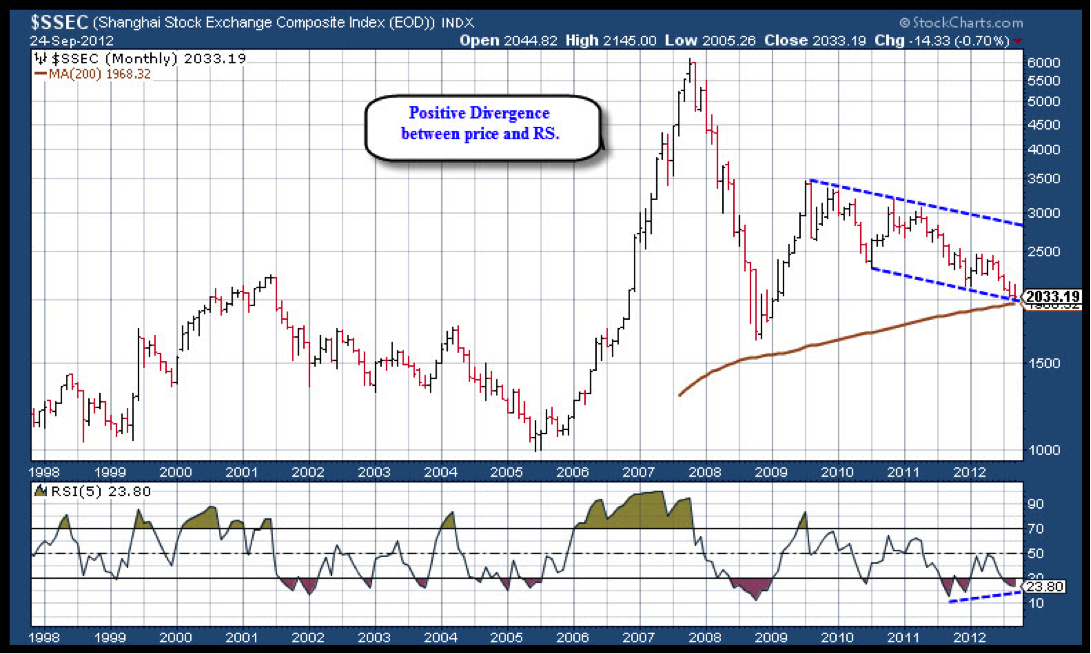
 The Shanghai Stock Exchange Index has been in relentless decline since the middle of 2009 and is now near the 200-month SMA. The monthly chart seen below is showing a positive divergence between price and RS at the most recent lows. As well, the index has declined to its lower channel line.
Could a rally be in the offing? Let’s dig a little deeper.
Shanghai Stock Exchange Index (Monthly)
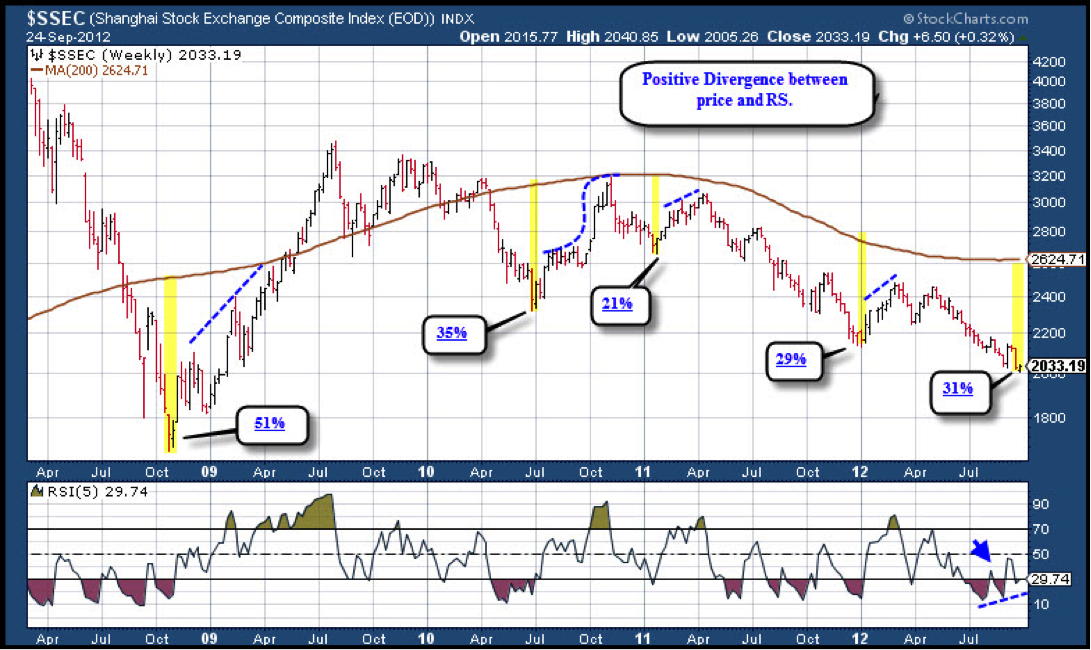
Once an index stabilizes at or near the 200-month SMA there is a high probability that it will begin a bear market rally that will top near the declining 200-week SMA. In the case of the Shanghai Stock Exchange Index the weekly chart is showing a positive divergence between price and RS at the most recent lows, and it is currently 31% below the 200-week SMA. The 31% is the widest deviation from the 200-week SMA since mid-2010.
Shanghai Stock Exchange Index (Weekly)
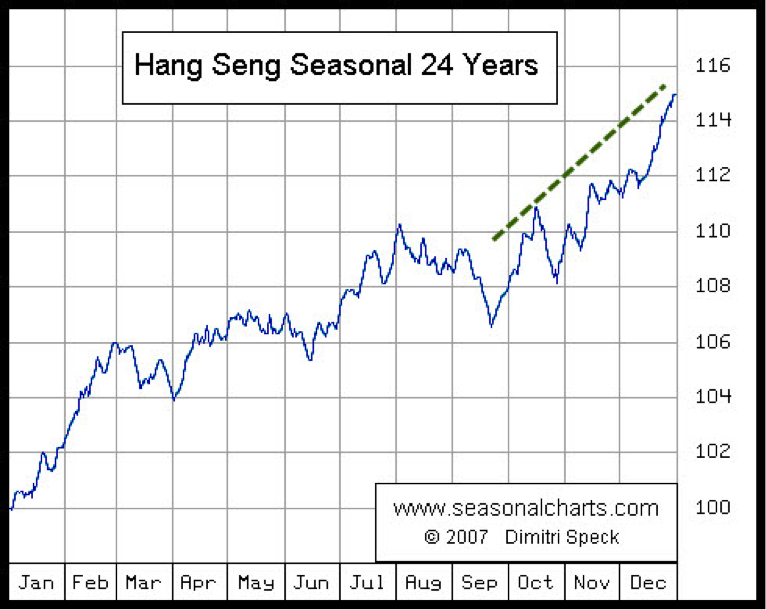
I was unable to locate any seasonality charts for the Shanghai Stock Exchange Index, but the seasonality chart for the Hang Seng is very bullish into the end of the year.
Stacking The Probabilities
- Positive Divergence: The monthly and weekly charts of the Shanghai Stock Exchange Index show a positive divergence between price and RS.
- Trend Deviation: The index has declined to the 200-month SMA which indicates an extreme deviation in the bear market trend. Likewise, the weekly chart is showing the widest deviation from the 200-week SMA since mid-2010.
- Seasonality: On the margin, the seasonality chart for the Hang Seng points to strong gains into the end of the year.
As traders/investors we seek to stack as many probabilities in our favor prior to the allocation of capital. In the case of Shanghai Stock Exchange Index, there is a convergence of key technical criteria that suggests that a meaningful rally is near. I anticipate a rally of 25-30% in the coming weeks/months.
—————————————————————-
Twitter: @hertcapital @seeitmarket Facebook: See It Market
No position in any of the securities mentioned at the time of publication.
Any opinions expressed herein are solely those of the author and do not in any way represent the views or opinions of any other person or entity.


