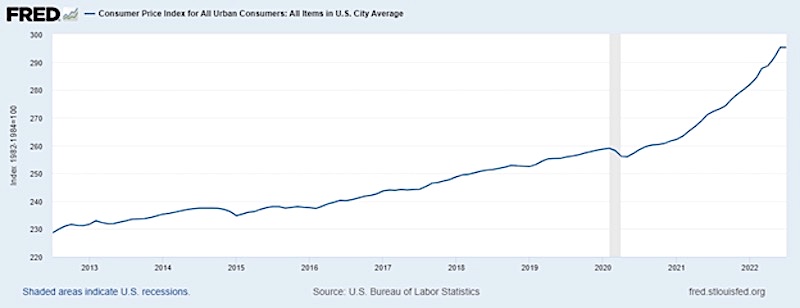
Consumer Price Index for All Urban Consumers: All Items in U.S. City Average (CPIAUCSL) Jul 2022: 295.271, Aug 10, 2022
The chart above is the Consumer Price Index for All Urban Consumers and reflects that inflation is historically high.
The Fed has been trying to get a handle on the inflation problem, but the graph seems to illustrate that inflation may not be contained.
The Fed has had to act. In increasing interest rates, the economy though, has slowed down.
Also commodity prices have been increasing since 2019 due to global demand and changing supply dynamics. Historically, commodity markets experience price volatility.
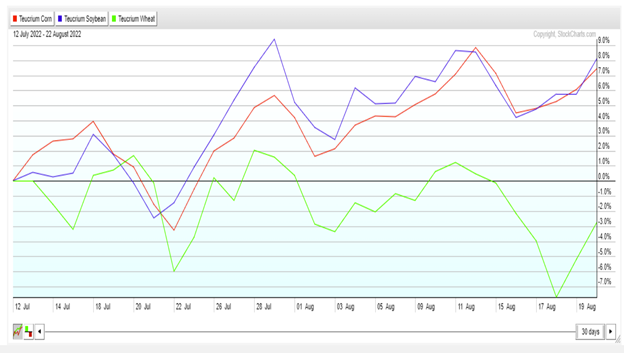
Since July 12 Teucrium Corn Fund are up 7% and Teucrium Soybean Funds 8% and Teucrium Wheat fund is down -3%.
These same factors have increased agricultural commodity prices in recent weeks. The grains appear to be slowly starting to recover in price from a previous rebound earlier this year.
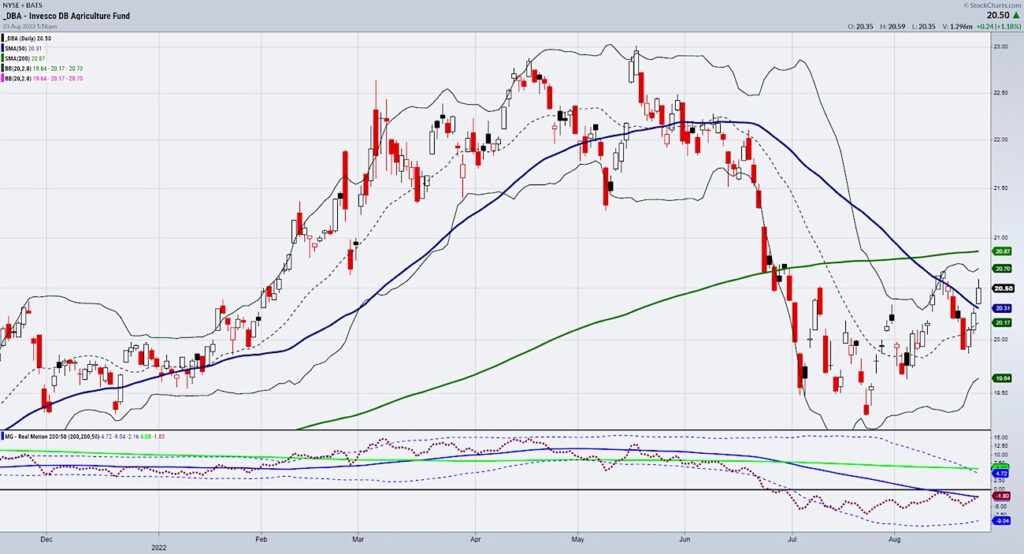
Grain prices are now rising due to strong global demand for these agricultural commodities and a lack of supply, due to adverse weather conditions, from droughts to floods, and the Ukraine conflict.
This new demand should lead to continued strength in agricultural commodity prices over the coming months.
It’s important to remember that commodity markets are incredibly volatile and can change rapidly so we advise actvely managing commodities in your portfolio.
Watch Michele “Mish” Schneider in the Media
Business First AM 08-23-22
BNN Bloomberg Before the Bell 08-23-22
Stock Market ETFs Trading Analysis and Summary:
S&P 500 (SPY) 410 pivotal support 397 major support 423 resistance.
Russell 2000 (IWM) 190 pivotal support, 180 major support, 199 resistance.
Dow Jones Industrials (DIA) 339 resistance with 319 major support.
Nasdaq (QQQ) 312.50 pivotal support, 301 major support and 325 resistance.
KRE (Regional Banks) 65.00 support 68 resistance.
SMH (Semiconductors) 222 the 50-DMA support and over 240 better.
IYT (Transportation) Through 243 better and must hold 225
IBB (Biotechnology) 123 the 50-DMA support to hold.
XRT (Retail) 67.20 must hold on a weekly close. If not, looking at 65.00 next.
Twitter: @marketminute
The author may have a position in mentioned securities at the time of publication. Any opinions expressed herein are solely those of the author and do not represent the views or opinions of any other person or entity.

 Flirting With Critical Support… Again")


