Some investors love gold all the time (often called gold bugs); some investors hate gold all the time, usually the result of losing money on the yellow metal.
We are neither as our view changes over time; but over the past couple of years we have been, and remain, fans of gold exposure for investors.
Initially, this positive stance on gold was predicated on valuations, the lack of quality defensive alternatives in a low-yield environment and our cooling longer-term outlook for the U.S. dollar.
A healthy gold allocation has certainly helped portfolios in 2020.
As a safe haven asset, the commodity and gold companies enjoyed solid gains during the bear market caused by the pandemic and also rose during the market recovery. The commodity spent the second half of 2019 rangebound around $1,500/oz and has ascended to a new range around $1,700/oz.
Gold companies followed suit but have given back some gains in the past month as the market has been more risk-on and safe-haven assets moved lower.
This raises the question for portfolio managers and asset allocators – is it too late for gold or are things just getting started?
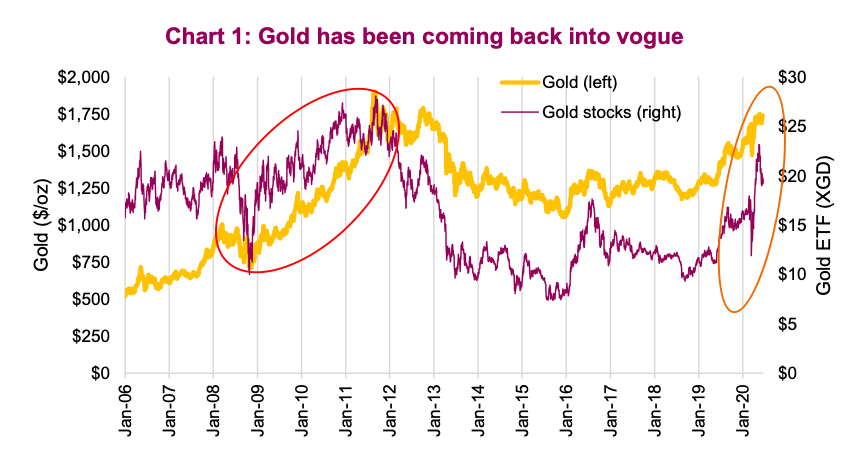
Repeat of 2009-2011?
Gold, both the commodity and gold stocks, declined during the financial crisis in 2008 as investors sold whatever they could, but then rebounded and went on for a multi-year advance (red circle). The initial pattern of a drop during the “sell everything” phase occurred during March 2020 as well, followed by a strong advance (orange circle).
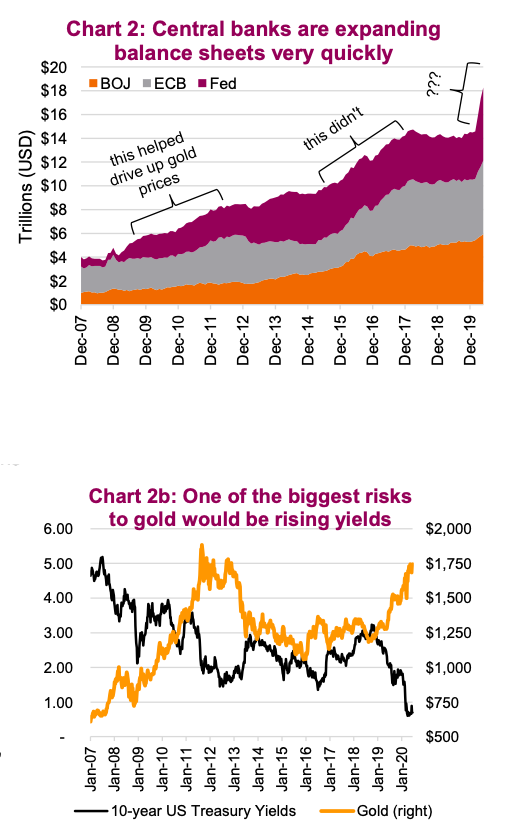
While we would not want to draw too many comparisons, perhaps one of the most noteworthy parallels is the rapid expansion of central bank balance sheets in 2009-11 with what is occurring today.
Quantitative easing (QE) is back in full force in response to the pandemic-driven recession, which has central bank balance sheets set to continue expanding in the near future (Chart 2). This has caused M2, the money supply in the U.S. economy, to expand at its fastest pace looking at data that goes back to the 1960s.
This would normally be inflationary if it occurred in isolation, but nothing occurs in isolation. Countering this is the likely stronger deflationary pressure of the recession that has prices falling and unemployment skyrocketing.
Given most central banks have embarked on QE, this puts downward pressure on their respective currencies. But since all are doing this and currencies are relative to one another, plus other contributing factors, it is difficult to discern the winners and losers. However, hard assets such as gold certainly benefit.
Coming out the other side
Successful investing requires you to focus on future outcomes and not simply react to what is happening today. So as the economies of the world emerge from this pandemic-induced recession, what can we expect? No doubt there will be a sharp economic recovery, but probably not all the way back to previous levels.
This could lead bond yields higher, which would be negative for the price of gold (chart 2b, yields and gold often move in opposite directions). This is a material risk – gold does not do well during the initial phases of rising yields.
However, we believe the central banks will maintain the bond-buying QE a little longer to keep a lid on yields and there will be some lingering deflationary pressures as well from the recession. That being said , this scenario appears to be planting the seeds for future inflationary pressures. This would be positive for gold, with the expectation of a soft patch during the transition. Gold has historically been a very good hedge against inflation and has historically done well when government debt rises (and it is rising).
This is not the 1970s – Whenever talk of inflation arises, folks quickly start thinking about the 1970s. That inflationary cycle was driven by demographics, commodity price shocks in both food then oil, the disruption of currencies moving off the gold standard and labor that was less mobile and enjoyed strong negotiation powers (unions, structure). That is not today (Chart 3).
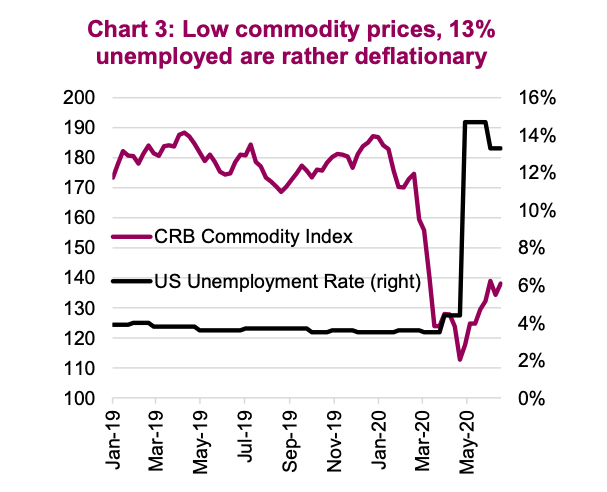
Commodity prices are low and while they could rise, they would have to go a long way before they moved from a deflationary force to an inflationary one. Demographics aren’t new; this has been putting downward pressure on both yields and inflation for years as the percentage of working folks in developed economies has shrunk. And while millennials may help start to offset this trend, a number of key emerging economies are about to start feeling this downward demographic force.
So, while runaway inflation remains a low probability event, some is likely coming. Monetary policy (QE) and a global economic recovering will lead to some. Plus, as companies revisit supply chains (that will cost more), China’s cheaper labor advantage appears largely played out, and global trade moves from blanket agreements to bipartisan, this will all contribute to some inflation, particularly the cost-push variety.
Don’t forget, governments (we the people) have racked up some pretty hefty tabs fighting this pandemic and helping the economy. When a government has too much debt, there are a number of solutions. The most tenable may be to continue policies that induce some inflation, as this does reduce the real debt level.
Still good to be long gold
In our opinion, the biggest risk to gold at the moment would be if 1) yields started to rise; 2) the market became very risk-on thereby hurting safe-haven assets; 3) profit taking; or 4) the U.S. dollar rose materially. We believe it is more likely that yields remain suppressed by central bank buying and deflationary pressures – scratch #1!
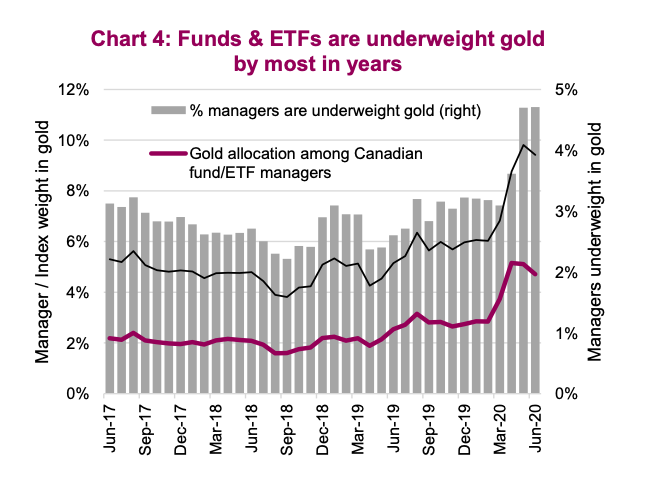
This market bounce has surprised just about everyone, but it is about to run into headwinds from potentially rising COVID-19 cases and a really tough Q2 earnings season –scratch#2! For the U.S.dollar, our longer term outlook for the U.S. dollar is in the downward direction – scratch #4! Profit taking is certainly a risk but it is worth noting that investors remain very underweight gold.
We calculated the dollar-weighted gold exposure among Canadian equity funds and ETFs over the past few years. The spread between fund gold exposure and the index is historically elevated, with funds underweight with about half that of the index (Chart 4). If this gold advance continues, more managers may join in to avoid being left behind (tracking error) – scratch #3!
Technical Take – given the recent pullback in gold equities, this could be a re-up
Gold completed a multi-year base in June 2019, finally breaking out over the elusive $1400/oz resistance level. Since that time, bullion prices have risen 25% and we have maintained, and in fact boosted, our bullish view as we look to an ultimate move to new record highs above $1921/oz which was set in September 2011.
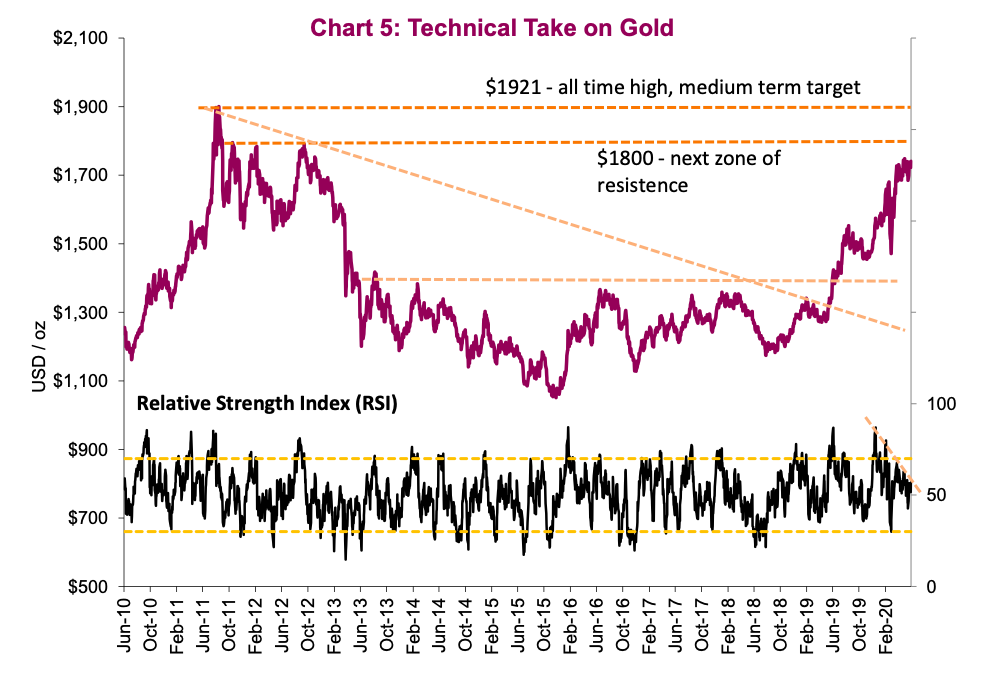
As the trend higher advances, there will be periods of consolidation, which can be useful to accumulate positions. The current trading range established since mid -April is what we would consider a pause in the longer-term bull trend, caused in part by the extreme levels of bullish consensus positioning, which have since normalized.
Above the $1,765/oz May high, we see the next area of resistance around $1,800/oz, which corresponds to the three failed attempts to break above that level back in 2012 and 2013, and ultimately the $1,921/oz record high. We maintain our view that gold will eventually take out that high but must respect the psychological resistance to be met as prices approach$2,000/oz.
From a short-term viewpoint, the daily relative strength indicator (RSI) continues to consolidate but remains firmly in positive territory with a reading of 57.
Similarly, other momentum measures have retrenched in recent months but remain $900 constructive of the medium/longer-term trend higher. One key thing to watch will be a breakout of the RSI above its falling trendline. Bullion tested its longer term moving average back in March but quickly regained its footing and remains back above its 50- and 200-day moving averages.
Source: All charts are sourced to Bloomberg L.P. and Richardson GMP unless otherwise stated.
Twitter: @ConnectedWealth
Any opinions expressed herein are solely those of the authors, and do not in any way represent the views or opinions of any other person or entity.

: Worrisome to Broader Market?")

