Gold has been an out-performer. Surging higher and faster than most assets in a sea of global uncertainty.
In January, however, the Gold ETF (GLD) posted a high and reversed lower.
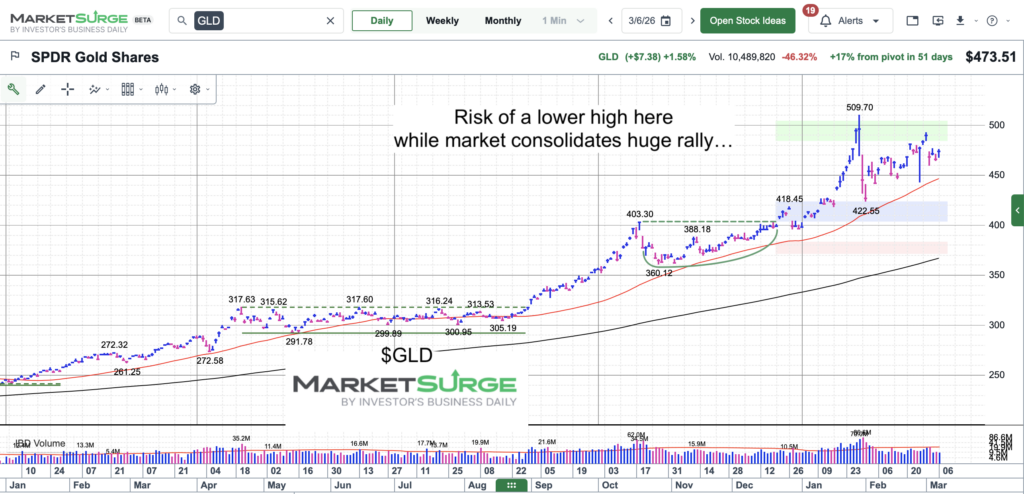
From there, gold has traded in a 17% price range and is consolidating its large rally.
That said, it is at risk of posted a lower high (not confirmed). This would likely come in the form of an A-B-C correction that tests the February low or undercuts it.
Note that the following MarketSurge charts are built with Investors Business Daily’s product suite.
I am an Investors Business Daily (IBD) partner and promote the use of their products. The entire platform offers a good mix of tools, education, and technical and fundamental data.
$GLD Gold ETF Chart
Here we can see the steep drop off from the January high, followed by a multi-week rally that may have ended in a lower high that may have ended on Monday. Major price support should come at the 50-day moving average, followed by the February low.
Twitter: @andrewnyquist
The author may have a position in mentioned securities at the time of publication. Any opinions expressed herein are solely those of the author, and do not in any way represent the views or opinions of any other person or entity.
")


")
