Gold has always been a tricky trade.
Day-to-day movements in the US Dollar and back-and-forth statements from the Federal Reserve only add to this.
That said, we can minimize the whipsaw by taking a broader view technically.
By analyzing the price action first, we can see what the trend looks like and factor in the fundamental variables to support/weaken our findings. Today we’ll eye up the daily and weekly charts for Gold to look for clues (probabilities) for what’s to come.
Note that the following MarketSmith charts are built with Investors Business Daily’s product suite.
I am an Investors Business Daily (IBD) partner and promote the use of their products. The entire platform offers a good mix of technical and fundamental data and education.
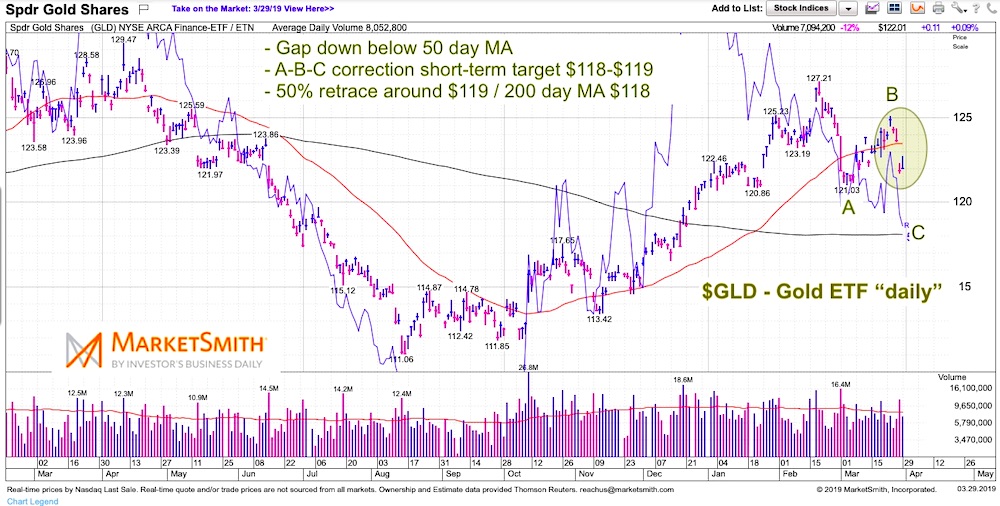
$GLD Gold “daily” Chart
Using the February high as a reference, we can see that gold pulled back to the March lows (A) before rallying to create a lower high (B).
We are now turning lower once more. Note that we gapped below the 50 day MA late last week. This momentum could break the March lows. If it does, we visit $118-$119 support by mid-April. That is the home of the 50 Fib and the 200 day MA. Shakeouts sometime pierce the 200 day MA, so price could go a bit lower. But bulls would not want to see multiple daily closings below the 200 day MA.
The US Dollar could be the impetus that pushes Gold down to this price area. The greenback has potential for 98 near-term and this type of a move would be short-term negative for gold.
Twitter: @andrewnyquist
The author has a position in mentioned securities at the time of publication. Any opinions expressed herein are solely those of the author, and do not in any way represent the views or opinions of any other person or entity.

 Testing Important Price Support")
: Cup (and Maybe Handle) Watch")

