After a stellar first 7 months of 2020, gold peaked in August and turned sideways-to-lower.
And it has been trading sideways-to-lower for what seemingly feels like forever.
This grinding action slowly churns traders out of the mix… and in this case, it wears on bulls.
So what’s next for gold? What should we be looking for in the price action? Today we take a step back and look at a long-term “weekly” chart and discuss some levels to watch and indicators to be aware of.
Note that the following MarketSmith charts are built with Investors Business Daily’s product suite.
I am an Investors Business Daily (IBD) partner and promote the use of their products. The entire platform offers a good mix of technical and fundamental data and education.
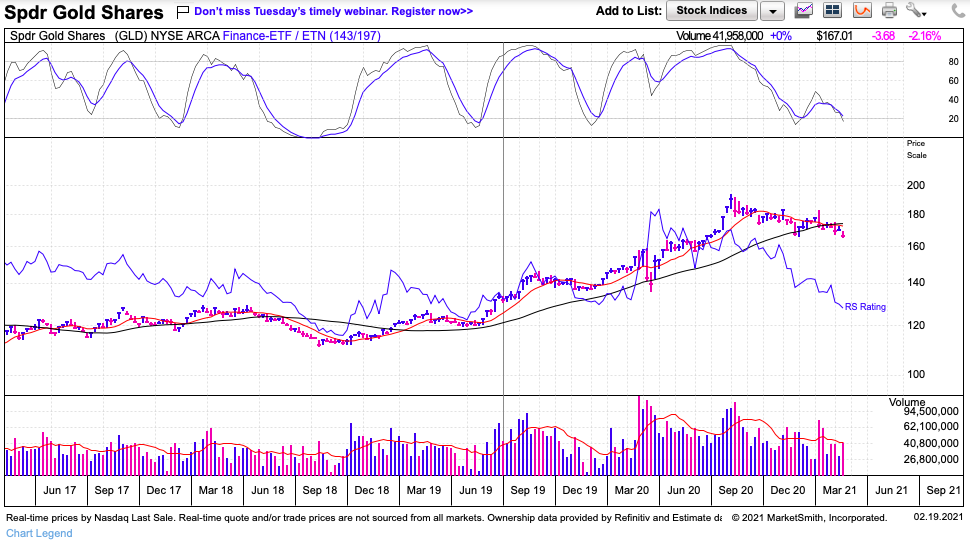
Gold “weekly” Chart
Gold bulls are likely disappointed with the price action considering that the US Dollar Index is trading around the 90 mark (weak). That said, the price action is king and all our hopes, desires, and concerns about assets mean nothing unless price is leading them.
In this case, the price action has been lower of late. Call it a consolidation but it’s clear that momentum is quite weak and relative strength is oversold. This could lead to near-term rallies, however we cannot expect a new bull leg higher until we see a strong reversal where price breaks out of its down-trend. For me, that would be a move over 183.21 (the highs from the first week of the year). Why? That week produced a significant reversal bar.
On the down-side… using the August 2018 lows and the August 2020 highs, we get a 38.2 Fibonacci price support area around $162.60. That seems to align with the last breakout area. So the recent lows came within a couple percent of that area. As well, the 61.8 Fib retrace of the March 2020 low to August 2020 high (a nearer term wave) is $159. So I’d think the $159 to $162 area would provide support.
It is also worth noting that a minor momentum divergence has emerged – so traders want to see momentum hold above its November 2020 lows while price touches new lows. So far so good. But, as I stated earlier, gold has been weak. Traders need to wait for a quality reversal higher that sees follow on buying before getting hopes up on a new bull leg. For now, eyes on $159-$162.
Twitter: @andrewnyquist
The author may have a position in mentioned securities at the time of publication. Any opinions expressed herein are solely those of the author, and do not in any way represent the views or opinions of any other person or entity.


