Precious metals have pulled back and the gold and silver miners have followed suit.
So when will bulls know that this correction is over? Depends which asset you are looking at.
Today, we are going to look at the Gold Miners ETF (GDX) and highlight a key Fibonacci level to watch… One that has already been touched on the recent bounce.
Let’s look at the chart.
Note that the following MarketSurge charts are built with Investors Business Daily’s product suite.
I am an Investors Business Daily (IBD) partner and promote the use of their products. The entire platform offers a good mix of tools, education, and technical and fundamental data.
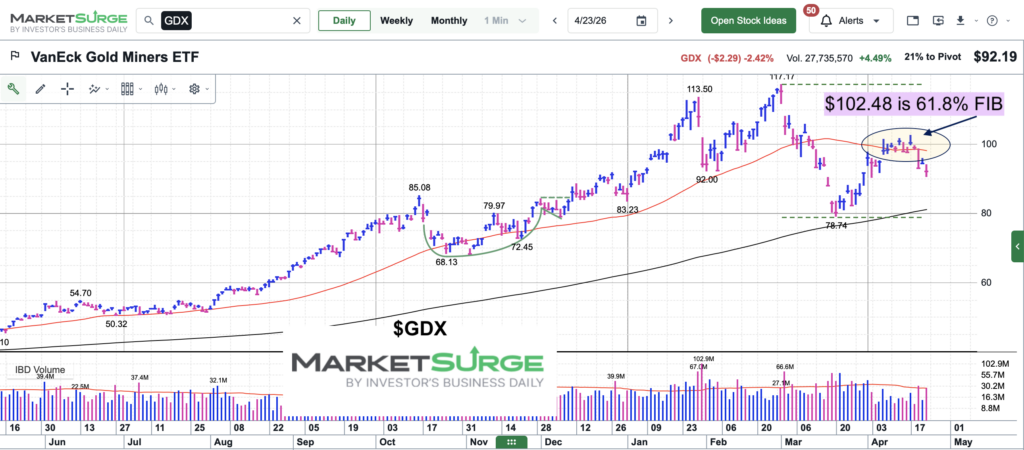
$GDX Gold Miners ETF Chart
Here we can see the multi-week correction (pullback), followed by an initial “bounce” attempt. This bounce reached back up slightly above its 50-day moving average and up to its 61.8% Fibonacci retracement level ($102.48). This level will serve as important resistance. Breaking above this level would be bullish.
Twitter: @andrewnyquist
The author may have a position in mentioned securities at the time of publication. Any opinions expressed herein are solely those of the author, and do not in any way represent the views or opinions of any other person or entity.


