Gold prices have moved back and forth within a range during the past four years, and price is testing the top of the range now.
The Elliott wave count we are using suggests a downward (bearish) reversal should happen from the edge of the range, and the reversal might already have begun.
This article shows analysis for the SPDR Gold Shares ETF (GLD). The pattern is different for gold futures, but the implications are the same in both markets. During approximately the next year, price should fall back down the the lower edge of the range before starting a more substantial climb that could persist through the rest of the decade. In the ETF, we are looking for completion of a five-wave impulsive structure up from the 2022 low. On a larger scale the impulse represents the final stage of the entire move up from the low in 2015. The subsequent decline should be related in size to the decline that happened between 2011 and 2015.
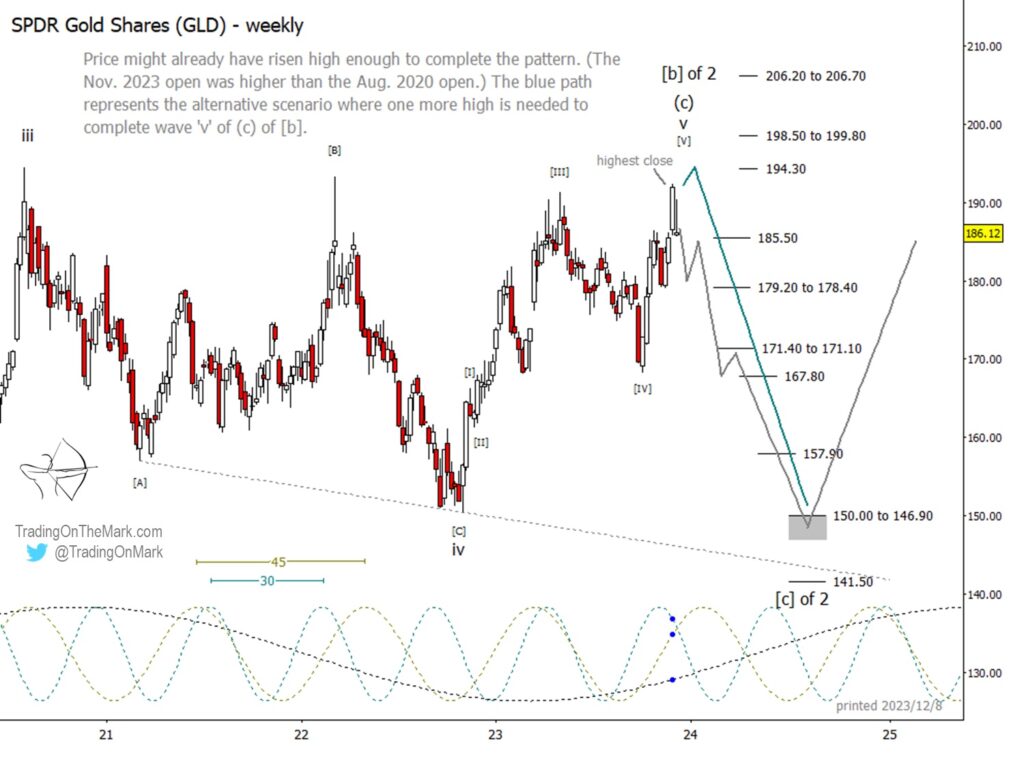
Ideally the move up from 2021 should exceed the 2020 high that is labelled as wave ‘iii’, and that criterion has not yet been met. However if one were looking at a “line on close” chart based on weekly closing prices, the criteria would have been met last week. Thus it’s possible that a minor new high might be needed in the near term, but the new high is not guaranteed. The reversal might already have begun, and we are treating that as the primary scenario as drawn with the grey path on the chart.
If the decline continues into December, watch for potential support near 185.50 and again near 179.20-178.40. A break of the higher support can lead to rapid decline into the lower one. Below that, our method identifies support areas near 171.40-171.10 and near 167.80. A break of 167.80 would assist bears’ efforts to reach toward the lower supports shown on the chart at 157.90, 150.00-146.90, and possibly even 141.50.
In the alternative scenario where GLD needs a minor new high to complete the current pattern, we would watch for resistance near 194.30. A break above the zone at 198.50-199.80 would signal that some other less bearish scenario is probably taking place and would prompt us to revise our wave count.
In both the primary and alternative scenarios, the decline from the upper edge of the range should consist of five sub-waves.
When the decline eventually finds support – probably somewhere between 150.00 and 141.50 – we would view that as a long-term buying opportunity for GLD and other precious metals.Trading On The Mark uses technical analysis to identify the trends and turns in highly traded markets for commodities, energy, currency, bonds and indices. Visit our website for more charts, and follow us on X for updates and special offers.
Twitter: @TradingOnMark
The authors may have a position in the mentioned securities at the time of publication. Any opinions expressed herein are solely those of the author, and do not in any way represent the views or opinions of any other person or entity.


