Gold Price Chart with “Weekly” Bars and Analysis
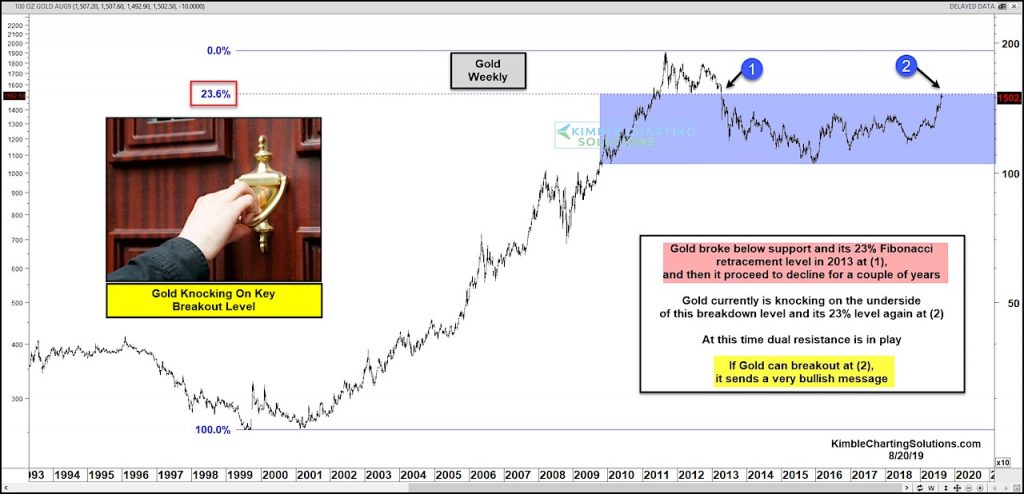
In 2013, Gold broke below its 23 percent Fibonacci retracement level and a bearish trend change took place at (1).
This was the beginning of a bigger decline that saw gold fall another 450 dollars.
Nearly six years later, Gold returns to this “breakdown” level in hopes of making it a new “breakout” level at (2).
If Gold can breakout at (2) it will send a very bullish message to the market.
Stay tuned – gold bulls are knocking on heaven’s door!
Note that KimbleCharting is offering a 2 week Free trial to See It Market readers. Just send me an email to services@kimblechartingsolutions.com for details to get set up.
Twitter: @KimbleCharting
Any opinions expressed herein are solely those of the author, and do not in any way represent the views or opinions of any other person or entity.


