Gold Futures “hourly” Chart
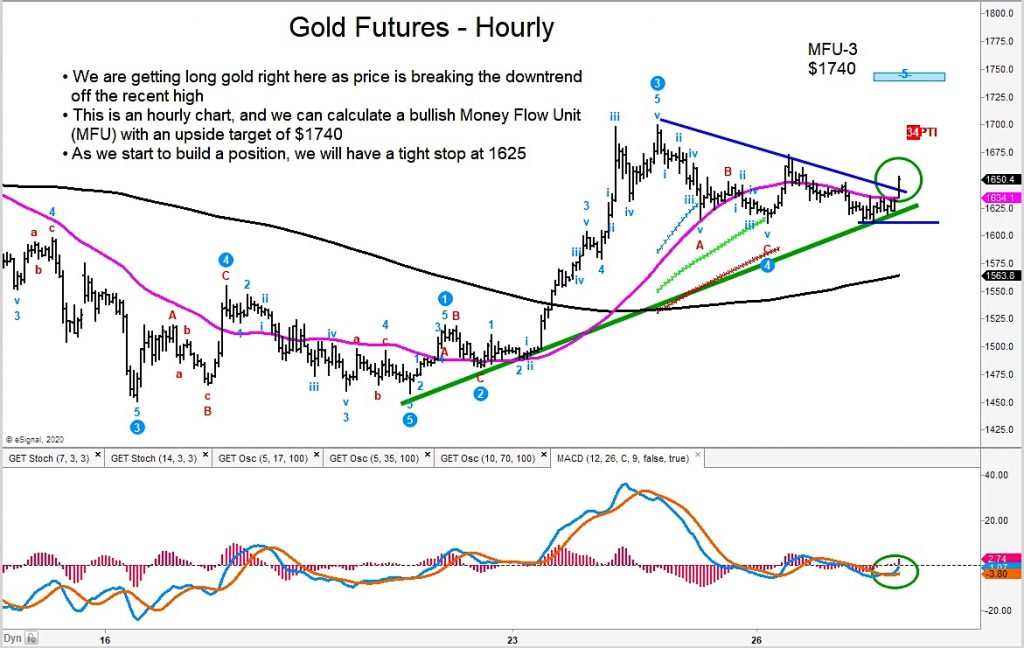
Gold futures surged overnight, attempting to break out over it’s short-term downtrend line and price consolidation.
You can see this in the “hourly” chart above.
Note this is a very short-term trading chart, so this is more of an observation for traders.
If this move holds, our upside target is $1740.
The markets are very fluid so our stop out area (exiting the trade for a loss) is $1625.
The author has a position in mentioned securities (Gold) at the time of publication. Any opinions expressed herein are solely those of the author, and do not in any way represent the views or opinions of any other person or entity.

 Rolling Over At Key Fibonacci Level?")


 Rolling Over At Key Fibonacci Level?")
