We haven’t written about gold prices for more than a year because for us there weren’t any high-confidence forecasts of trending moves. The market is changing now.
The consolidation that began in 2015 has coiled up nicely and led us to identify two leading breakout scenarios.
In this post we describe the main Elliott wave scenario for the SPDR Gold Trust (NYSEARCA: GLD). Meanwhile the forthcoming edition of our newsletter explains the main and alternate scenario for the Gold ETF (GLD) and gold futures.
If the consolidation since 2016 has been an Elliott wave triangle as we believe, then the minimum conditions for the triangle’s completion have been met. The move out of the triangle should be downward, and it could be strongly impulsive.
To put it in a larger context, the decline from 2011 to 2015 should be wave [a] of some corrective pattern, and the lengthy consolidation since 2015 should be wave [b]. A downward impulse would constitute wave [c] and would eventually plant a very durable low for gold.
The support levels on the GLD chart below – our main GLD scenario – show big-picture targets that wave [c] should interact with if a declining wave [c] proceeds from the current price level. Initial confirmation would come with a weekly close beneath 122.17, and a break of that level should lead price quickly to 116.67.
Preliminary lower targets for the Gold ETF include 101.26 and 93.20, but we view 116.67 as the safer target.
$GLD Gold ETF “weekly” Elliott Wave Chart
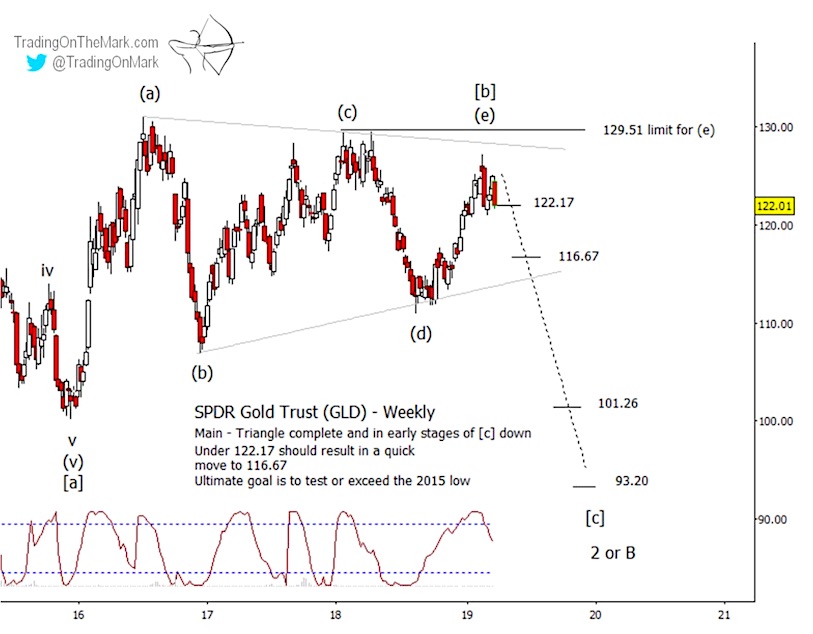
The support calculations are based on the assumption that the final wave (e) of the triangle is now complete, but that is not a certainty. Wave (e) is allowed to reach as high as 129.51 before the triangle scenario can be ruled out. For traders, that means choosing entries carefully based on either “peak” indicators or breakout events.
We note that the Lomb periodogram, which estimates the price cycle, is just now coming off its high reading. That lends more favor to the prospect that wave (e) is complete.
Our forthcoming newsletter describes the alternate scenario for GLD and also shows the wave counts for gold futures. You can request your free copy here. Newsletter readers receive exclusive charts, analysis and opportunities to save on TOTM subscription packages.
Twitter: @TradingOnMark
The authors may have a position in the mentioned securities at the time of publication. Any opinions expressed herein are solely those of the author, and do not in any way represent the views or opinions of any other person or entity.


