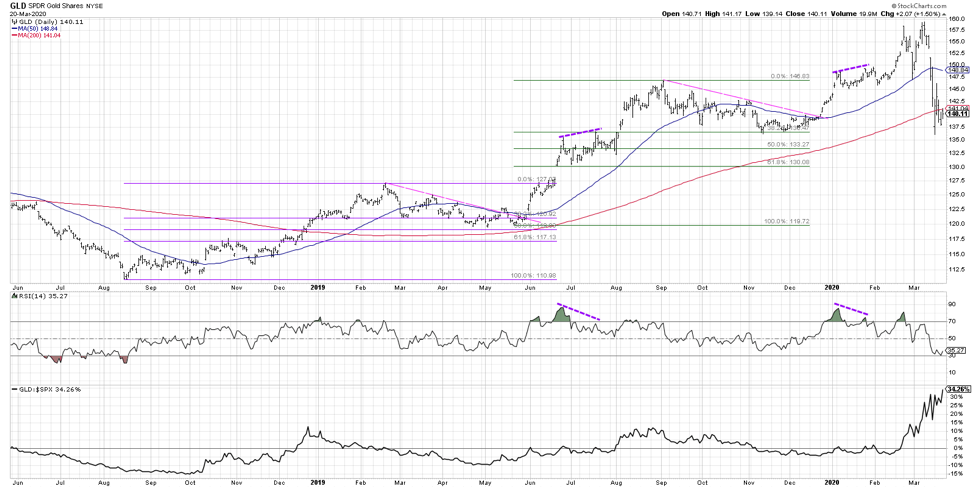
This week’s “One Chart” is the daily chart of the SPDR Gold ETF NYSEARCA: GLD going back for the last two years.
Gold is a really interesting chart because people tend to think of it as a safe haven, but it has not necessary been playing out that way in recent weeks and months.
If you look at gold leading up to the market sell-off we just recently experienced, you’ll notice a repetitive pattern starting to emerge.
Starting in the 3rd/4th quarter of 2018 you’ll see a rally into a peak in February 2019.
Gold then pulled back about 38.2% of the way, broke above trend line resistance, broke to new highs, then accelerated into what’s called a bearish divergence.
A bearish divergence is when you have higher highs in price and lower peaks in the RSI. This bearish divergence was invalidated in August 2019 when it again broke to new highs and the RSI broke above that trend line resistance.
That same series of events happened all over again in the second half of 2019. We see the big rally, the pullback around 38.2% of the way, the breakout above trend line resistance, and the break to new highs. Again, a bearish divergence emerges with higher highs in price and lower peaks in the RSI. And once again, it was invalidated when gold went to new highs in mid-February, and the RSI broke out again.
After this last series, however, things have become a little strange. Normally you would expect that if the market is really rupturing, a “safe haven” like gold would perform fairly well. That’s not really been the case. Gold actually held up toward the end of February and into the first week of March as stocks were aggressively selling off. But shortly after, GLD, along with pretty much everything other than the US Dollar, started rolling over.
Now that things are starting to stabilize a bit, three things stand out to me while looking at the chart of gold.
First, gold has broken down through its 200-day moving average for the first time since December 2018. But what we haven’t seen yet is a real confirmation day, a real follow-through to the downside. So breaking down through the 200-day moving average is an initial warning signal.
Second, we found support back in November/December 2019 around $136.50, which was the low a few times. We’ve retested that low- we broke down through the 200-day and closed back above, and again we found support right around that $136.50 level. In my opinion, this is the line in the sand. If the GLD breaks below this $136.50 level, that opens the way down to $130, which is the upper end of the gap from last summer. This $130 level is also the next Fibonacci support level, so to me, this would be the first downside objective.
What could potentially prevent this, or at least pause it, is the fact that the RSI just touched the oversold level. The RSI has been in the bull market range, not really getting near the oversold level since August 2019. It had been in a bullish mode, ranging between 40 up to 80 pretty consistently. This has now changed, and the RSI is more in the bearish mode where it’s getting down into the oversold region.
The fact that GLD has been oversold usually suggests a bit of an upside reversal, so I wouldn’t be surprised if we continue to see a nice bounce off that Fibonacci support level around $136.50. If we break this level, I think that’s the signal we’re headed toward $130, if not lower.
The third reason why gold is such an important chart right now is relative strength. Even with the choppiness, pullback, and downtrend that we’ve seen in the GLD lately, it has still outperformed most assets in the last 6 weeks. It has also outperformed the S&P 500 in the last month by over 30% on a relative basis.
To watch this in video format, just head over to my YouTube Channel!
Twitter: @DKellerCMT
The author does not have a position in mentioned securities at the time of publication. Any opinions expressed herein are solely those of the author, and do not in any way represent the views or opinions of any other person or entity.

: Showing Some Signs of Emerging Strength")
