The chart below looks at non-commercial futures trading positions for Gold. For the week Gold traded slightly higher.
The SPDR Gold ETF (NYSEARCA: GLD) closed higher by +0.8%.
Here’s a look at Crude Oil futures speculative positioning. Scroll further down for commentary and analysis.
Note that the chart and data that follow highlight non-commercial commodity futures trading positions as of March 5, 2018. This data was released with the March 8, 2019 COT Report (Commitment of Traders).
Note that this chart also appeared on my blog.
Gold prices have been volatile of late, with buyers swooping in at the end of the week to stem the short-term selloff. Let’s look at the COT data and technicals to see what’s next.
GOLD: Currently net long 88k, down 47.7k.
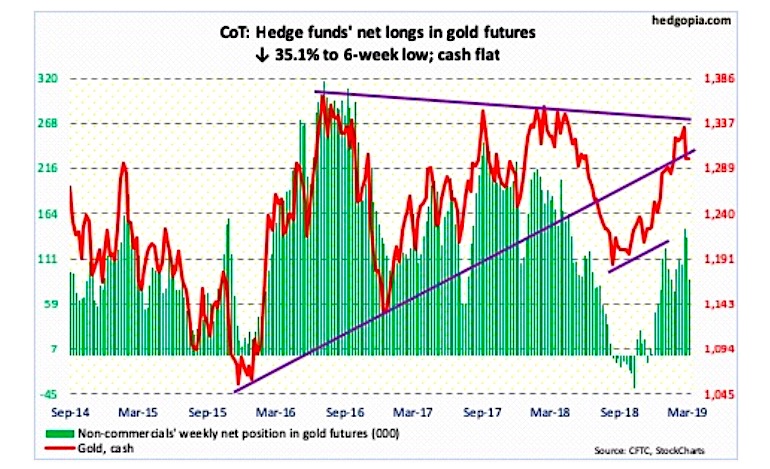
Three weeks ago, gold’s six-month advance ended with a weekly shooting star after rallying to $1,349.80/ounce. There was major resistance at $1,350-$1,360.
Early this week, the cash ($1,299.3) lost the 50-day, as well as $1,300. But gold bugs put their foot down in the remaining sessions. The daily is oversold. Bulls need to recapture $1,300 to regain momentum.
Non-commercials continued to cut back net longs, even as GLD (SPDR gold ETF) in the week to Wednesday lost $921 million, for outflows of $2.4 billion in the past five (courtesy of ETF.com). The metal still managed to end the week flat.
Twitter: @hedgopia
Author may hold a position in mentioned securities at the time of publication. Any opinions expressed herein are solely those of the author, and do not in any way represent the views or opinions of any other person or entity.

: Worrisome to Broader Market?")
