After a strong rally to start 2018, Gold prices (NYSEARCA:GLD) have fizzled out… again.
Will this ordinary decline turn into a more significant one?
It very well could… especially for those holding in US dollars.
In the 2-pack of charts below, we can see the recent pain for gold bulls.
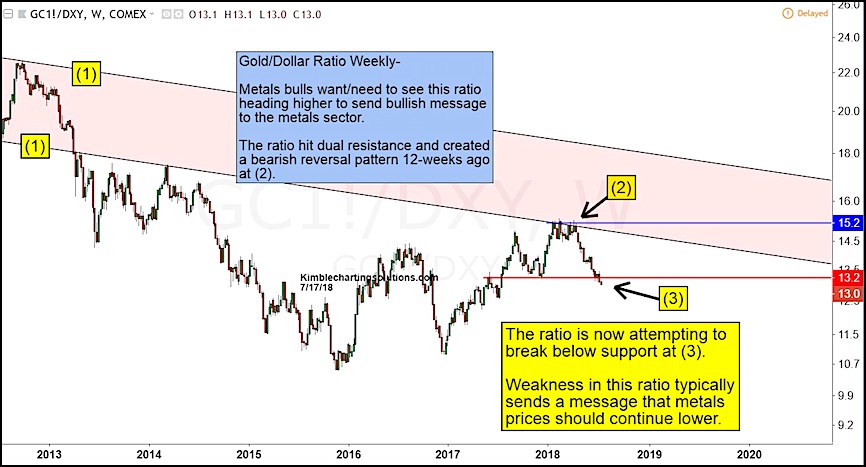
They had an opportunity earlier this year to breakout above resistance but that was foiled by a reversal pattern – you can see this in the first chart of the Gold to US Dollar ratio (point 2). That reversal came at dual resistance (2), marked by 2018 highs and the underside of a prior downtrend channel.
The Gold to US Dollar ratio has declined sharply over the past ten weeks, making new 2018 lows and breaking down through important horizontal support (3).
Gold to US Dollar Ratio Chart
US Dollar strength (NYSEARCA:UUP) has always been a thorn in the Gold Bulls side. Though it is just one of several variable that effect the price of gold, it is an important one.
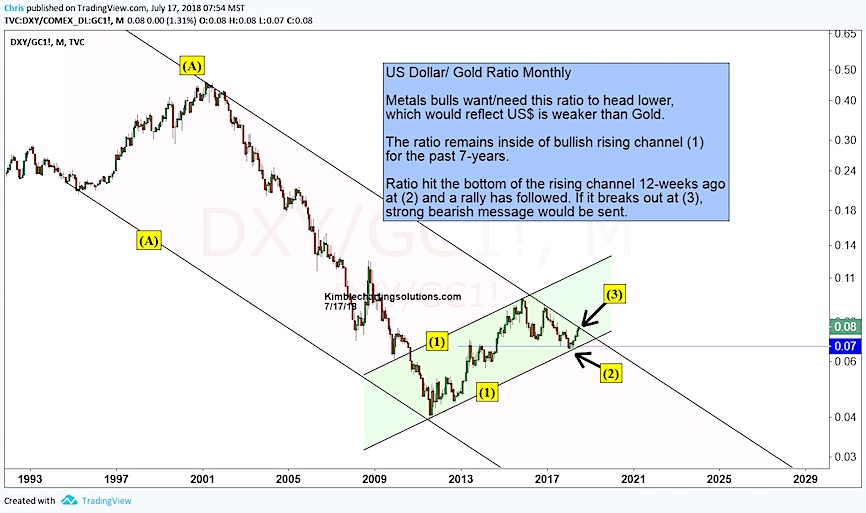
In the US Dollar to Gold ratio chart below (the inverse of the first chart), we can see that the ratio is threatening to break out of a down-trending channel (A) at point (3). A breakout to the upside would signal US Dollar strength, as well as another headwind for gold bulls.
US Dollar to Gold Ratio Chart
Note that KimbleCharting is offering a 30 day Free trial to See It Market readers. Just send me an email to services@kimblechartingsolutions.com for details to get set up.
Twitter: @KimbleCharting
Any opinions expressed herein are solely those of the author, and do not in any way represent the views or opinions of any other person or entity.


