Is the nearly 8 year decline in Gold prices coming to an end?
That may depend on what Gold does in the days/weeks ahead.
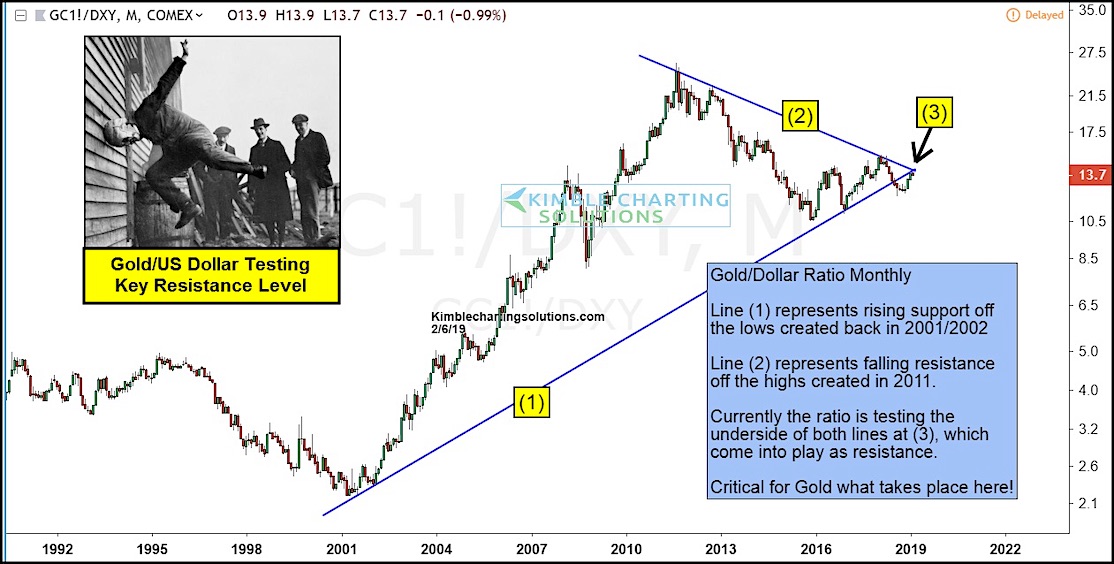
Today’s chart highlights the ratio of Gold to the US Dollar. And as you can see, the ratio has been marching higher for several weeks, grabbing the attention of gold bulls.
But the Gold / US Dollar ratio is nearing a critical juncture, testing the underside of its uptrend line and falling resistance.
This could be one of the most important price tests in years for Gold.
Metals bulls want to see a breakout above this dual long-term resistance line. Stay tuned!
GOLD / US Dollar Chart
Note that KimbleCharting is offering a 2 week Free trial to See It Market readers. Just send me an email to services@kimblechartingsolutions.com for details to get set up.
Twitter: @KimbleCharting
Any opinions expressed herein are solely those of the author, and do not in any way represent the views or opinions of any other person or entity.
: Creating Bullish Divergence?")


: Creating Bullish Divergence?")