The month of August came and went and the price of Gold remained fairly steady. The economic environment continues to be uncertain and perhaps that has kept gold prices elevated.
So why should gold bulls be worried?
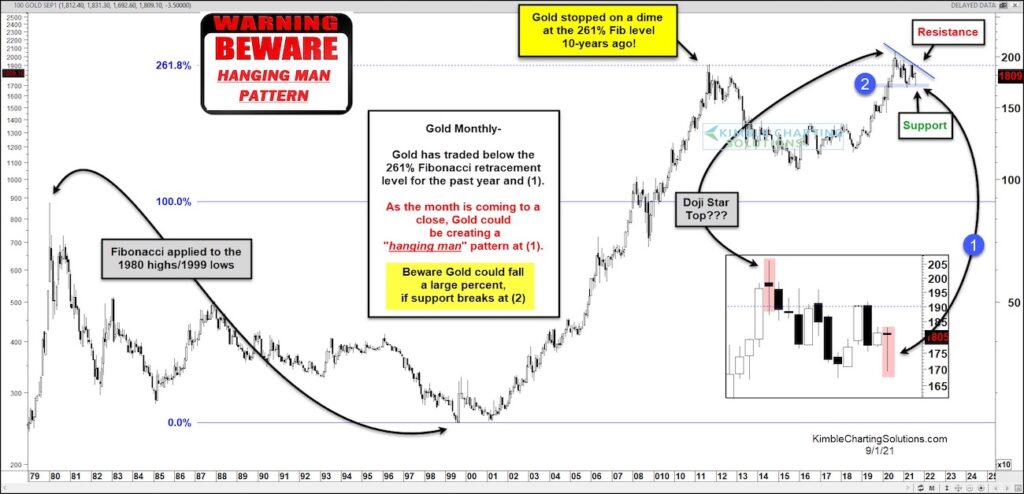
Perhaps a look at the “monthly” price chart will help. First and foremost, I’ll draw your eyes to the 261% Fibonacci extension. Gold stopped on a dime 10 year ago at this level. Just last year the price of gold rallied up to retest (and briefly break above) the 261% Fib level. But ultimately that breakout attempt failed.
Note that Gold has been trading below this key Fibonacci level for the past year – see zoomed in at (1). During this time, key support and resistance have formed at – support is highlighted at (2).
Two particular candlesticks have me concerned. The first is the potential doji star top from last year. That started the pullback. And the second is the newly formed “hanging man” candlestick from August. Beware that gold could fall a large percent if this bearish candlestick proves true and support breaks at (2). Stay tuned!
Gold “monthly” Price Chart
Note that KimbleCharting is offering a 2 week Free trial to See It Market readers. Just send me an email to services@kimblechartingsolutions.com for details to get set up.
Twitter: @KimbleCharting
Any opinions expressed herein are solely those of the author, and do not in any way represent the views or opinions of any other person or entity.


: Showing Some Signs of Emerging Strength")
