Last week I pointed out a potential top on the US Dollar / Gold ratio. That would be bullish for gold bugs.
This week, I have another potentially bullish setup to show you.
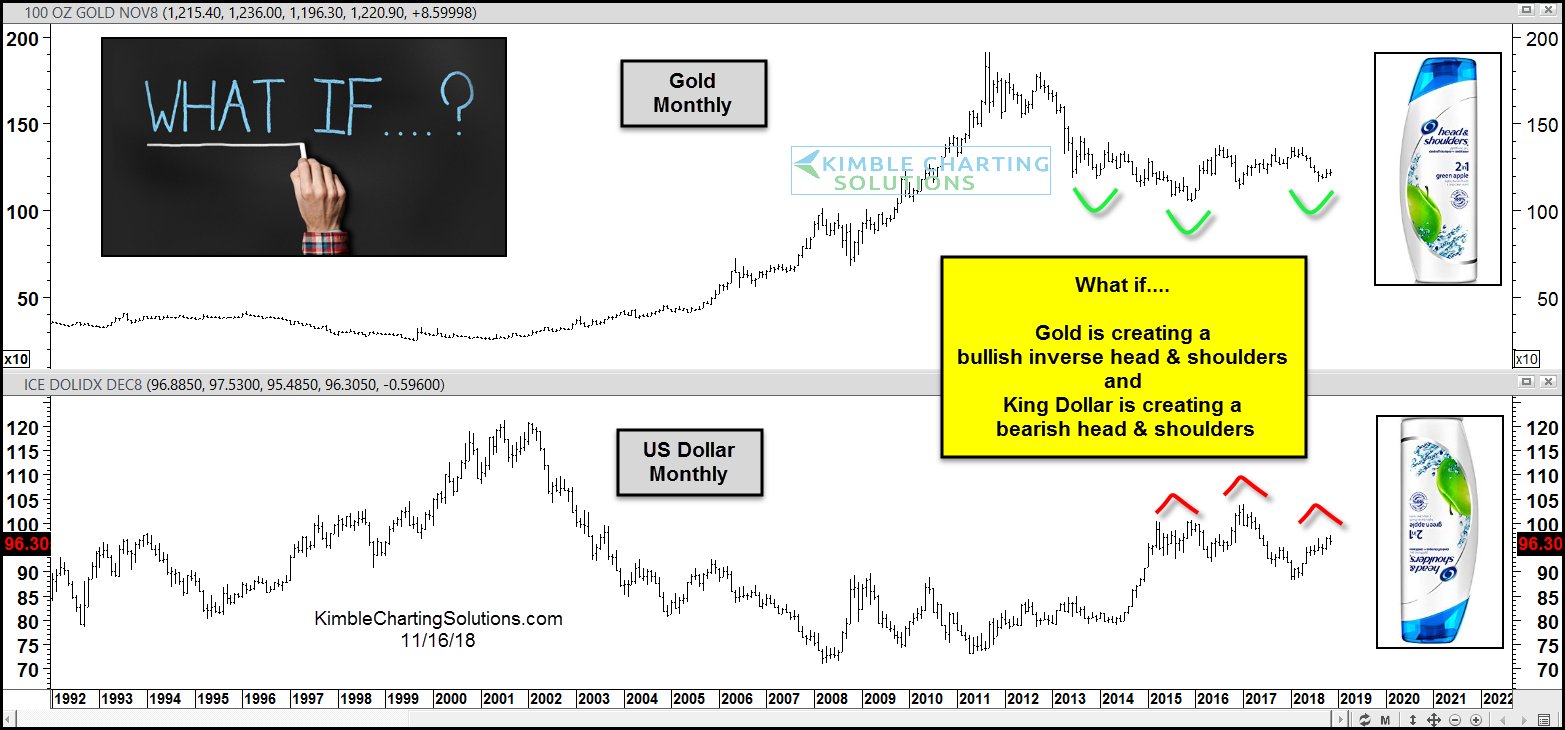
As most of you are aware, any weakness in the US Dollar is good for gold prices.
In the chart 2-pack below, we look at Gold and the US Dollar Index on a monthly basis.
Gold (NYSEARCA: GLD) is attempting to form a bottoming base in the form of an inverse head & shoulders pattern. At the same time, the U.S. Dollar is forming a potential head and shoulders topping pattern.
Perhaps it’s too obvious… but traders should pay attention to these patterns and how they play out!
Gold vs US Dollar Chart – Head & Shoulders Patterns?
Note that KimbleCharting is offering a 2 week Free trial to See It Market readers. Just send me an email to services@kimblechartingsolutions.com for details to get set up.
Twitter: @KimbleCharting
Any opinions expressed herein are solely those of the author, and do not in any way represent the views or opinions of any other person or entity.


: Showing Some Signs of Emerging Strength")
