A combination of recent central bank action and current talk of negative interest rates has brought out a thick wave of investor uncertainty in the financial markets.
And that has brought about a huge “flight to safety” transition of capital for investors. Basically, the “flight” to safety has lead to lower prices for stocks, and higher prices for Gold and US Treasury Bonds.
But it appears to be a case of too far, too fast.
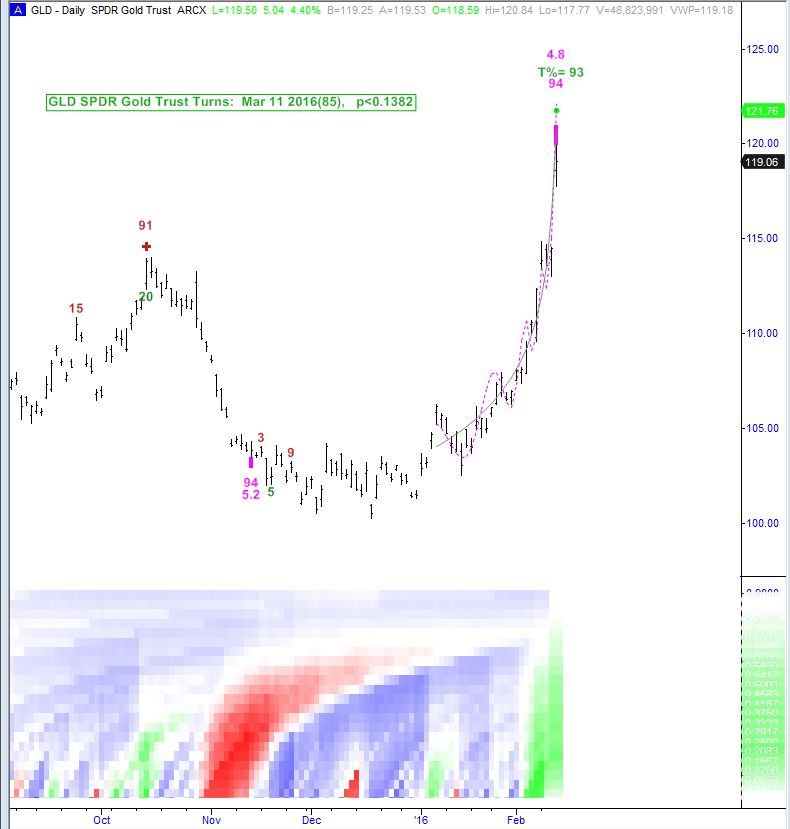
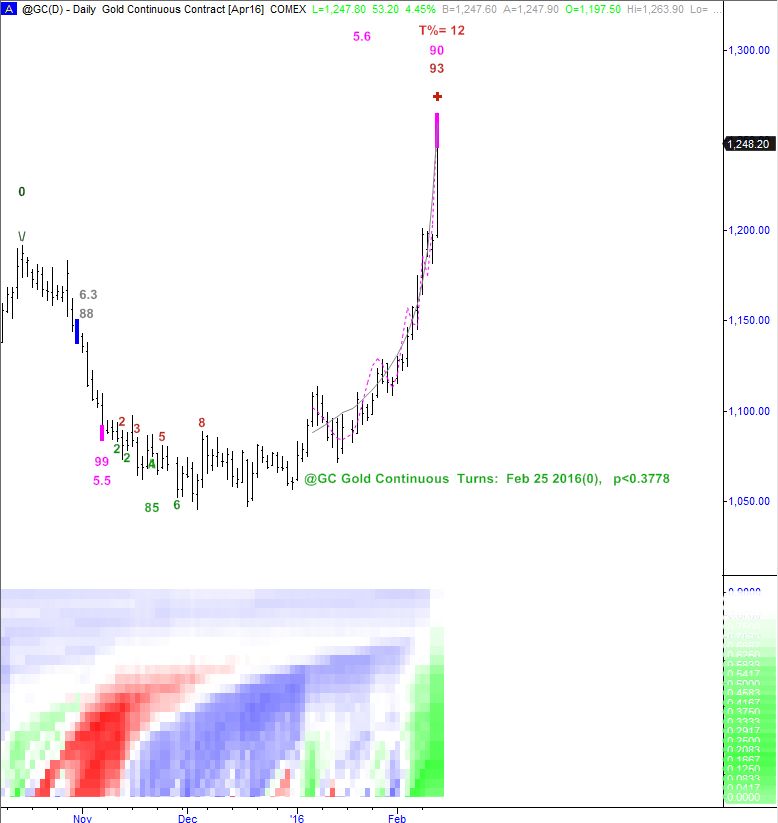
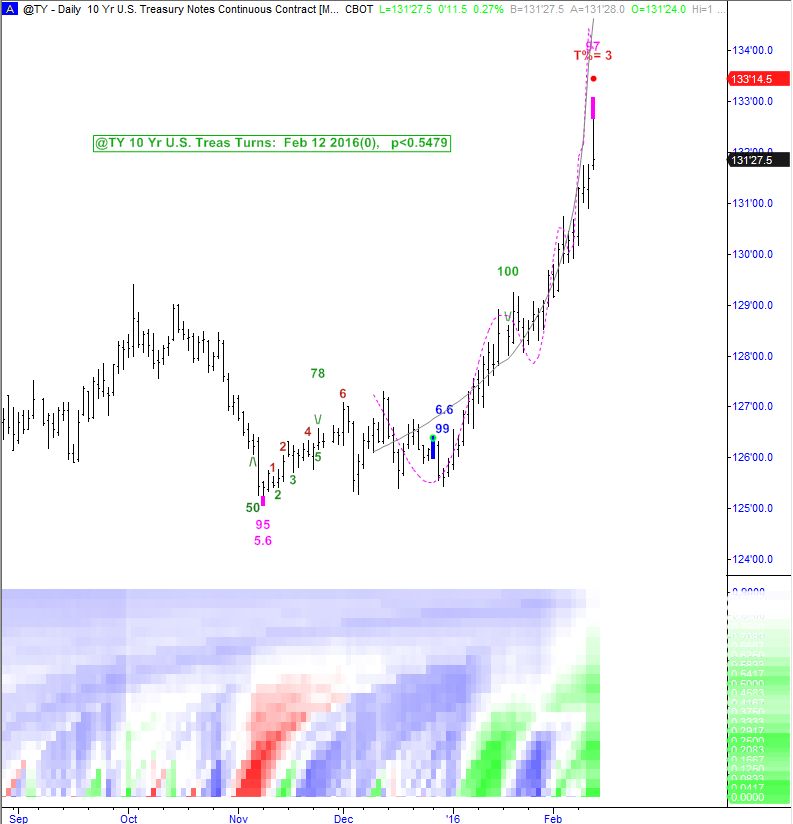
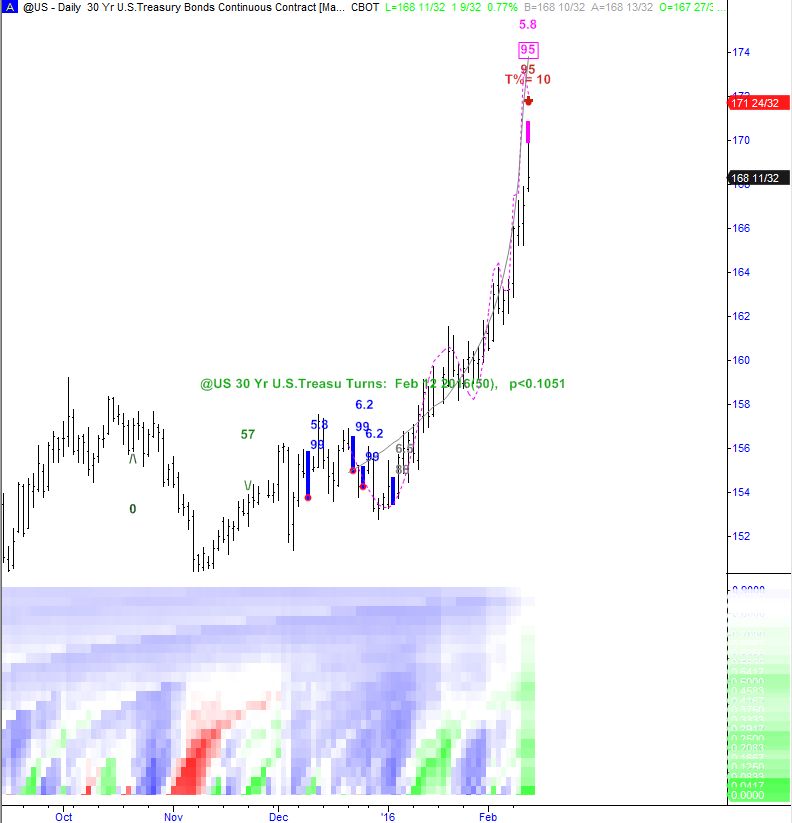
Given the signals that I am seeing, we are likely due for at least a pause here in both Gold and US treasuries. In the charts below, I highlight Extremehurst(TM) signals that are showing overextended price action. Remember Extremehurst signals indicate END of TRENDS (within a designated time frame) not necessarily reversals.
Gold and Treasury Bonds are at price extremes.
Here are the charts depicting the current price action and why the trends are due for a pause.
Gold ETF (GLD) Chart
Gold Continuous Contract Chart
10 Year US Treasury Bond Chart
30 Year Us Treasury Bond Chart
Note that Extremehurst(TM) signals are provided by Parallax Financial Research, a partner that I work with. You can learn more about Extremehurst signals by watching this video.
Thanks for reading and have a great weekend.
Further reading from Alex: “5 Charts That Show Why I’m Starting To Like Gold” (July 25 2015)
Twitter: @interestratearb
The author is looking for related directional trades at the time of publication. Any opinions expressed herein are solely those of the author, and do not in any way represent the views or opinions of any other person or entity.


