Over the past several weeks, I’ve shared several examples of key stock market indexes and indicators hitting long-term resistance.
Today, we’ll do the same… but with a much wider lens. We’ll look at 9 different stock market indexes in the developed markets that look concerning.
When a stock or market index hits resistance, it has three possibilities: 1) to breakout above resistance 2) to move sideways / consolidate near resistance 3) to turn lower and pullback or correct.
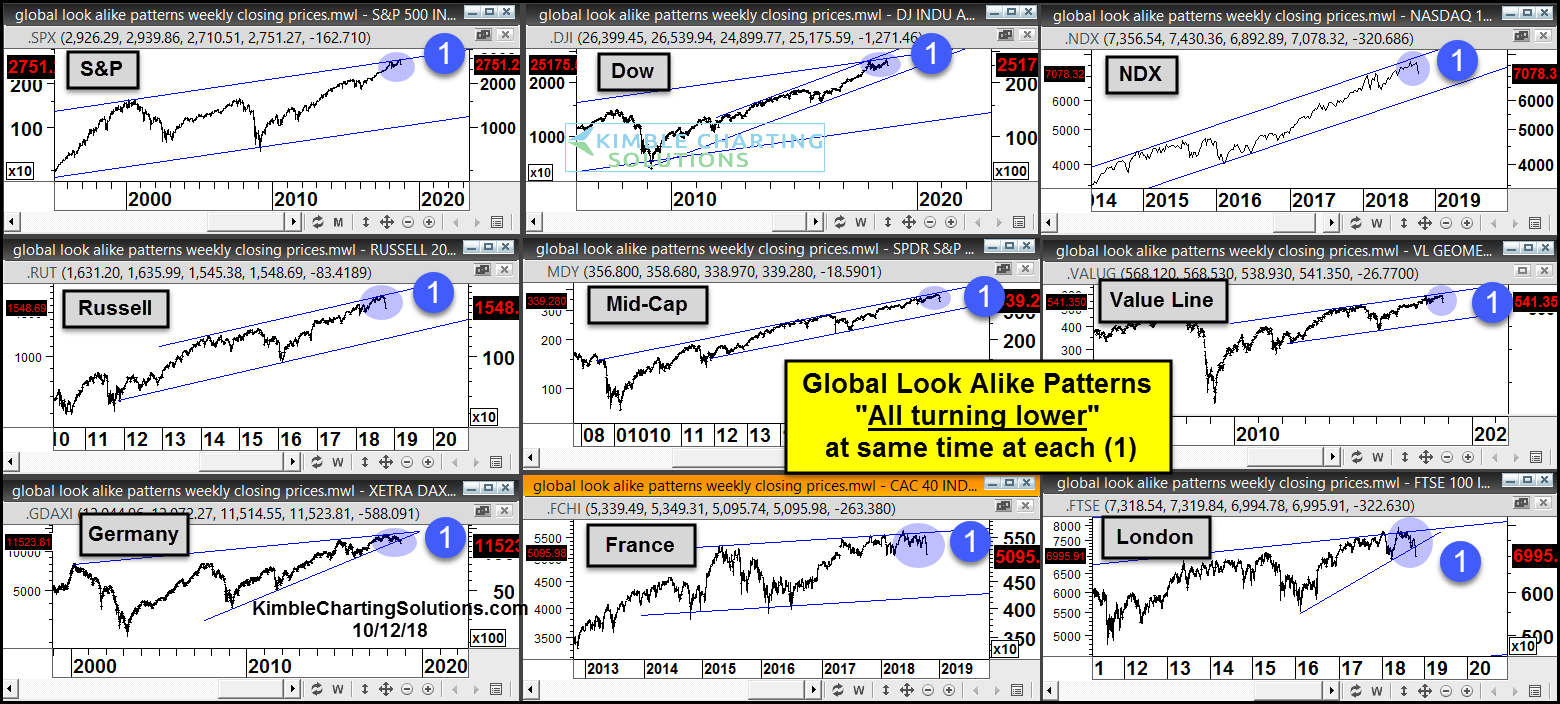
In the 9-pack of charts below, we are seeing bearish “look alike” patterns emerging. And in each case, it looks like the given markets are turning lower (point 1).
The markets considered include 6 U.S. indexes and 3 European, including the S&P 500 (NYSEARCA: SPY), Dow Jones Industrial Average (NYSEARCA: DIA), Nasdaq 100 (NASDAQ: QQQ), Russell 2000 (NYSEARCA: IWM), Mid-Caps Index, Value Line Index, German DAX, French CAC 40, and London’s FTSE 100. It’s a pretty good glimpse at a portion of the developed markets.
If these markets see follow through selling, investors could be in for a deeper decline.
9-Pack of Global Stock Market Indexes – Bears Growling?
Note that KimbleCharting is offering a 30 day Free trial to See It Market readers. Just send me an email to services@kimblechartingsolutions.com for details to get set up.
Twitter: @KimbleCharting
Any opinions expressed herein are solely those of the author, and do not in any way represent the views or opinions of any other person or entity.


: Showing Some Signs of Emerging Strength")
