Looking at U.S. and Global Market Breadth
We follow market breadth to give us an indication about the health of the trend for the S&P 500. And we broaden our approach to look at global stock market breadth when looking at domestic vs international.
S&P 500 Breadth
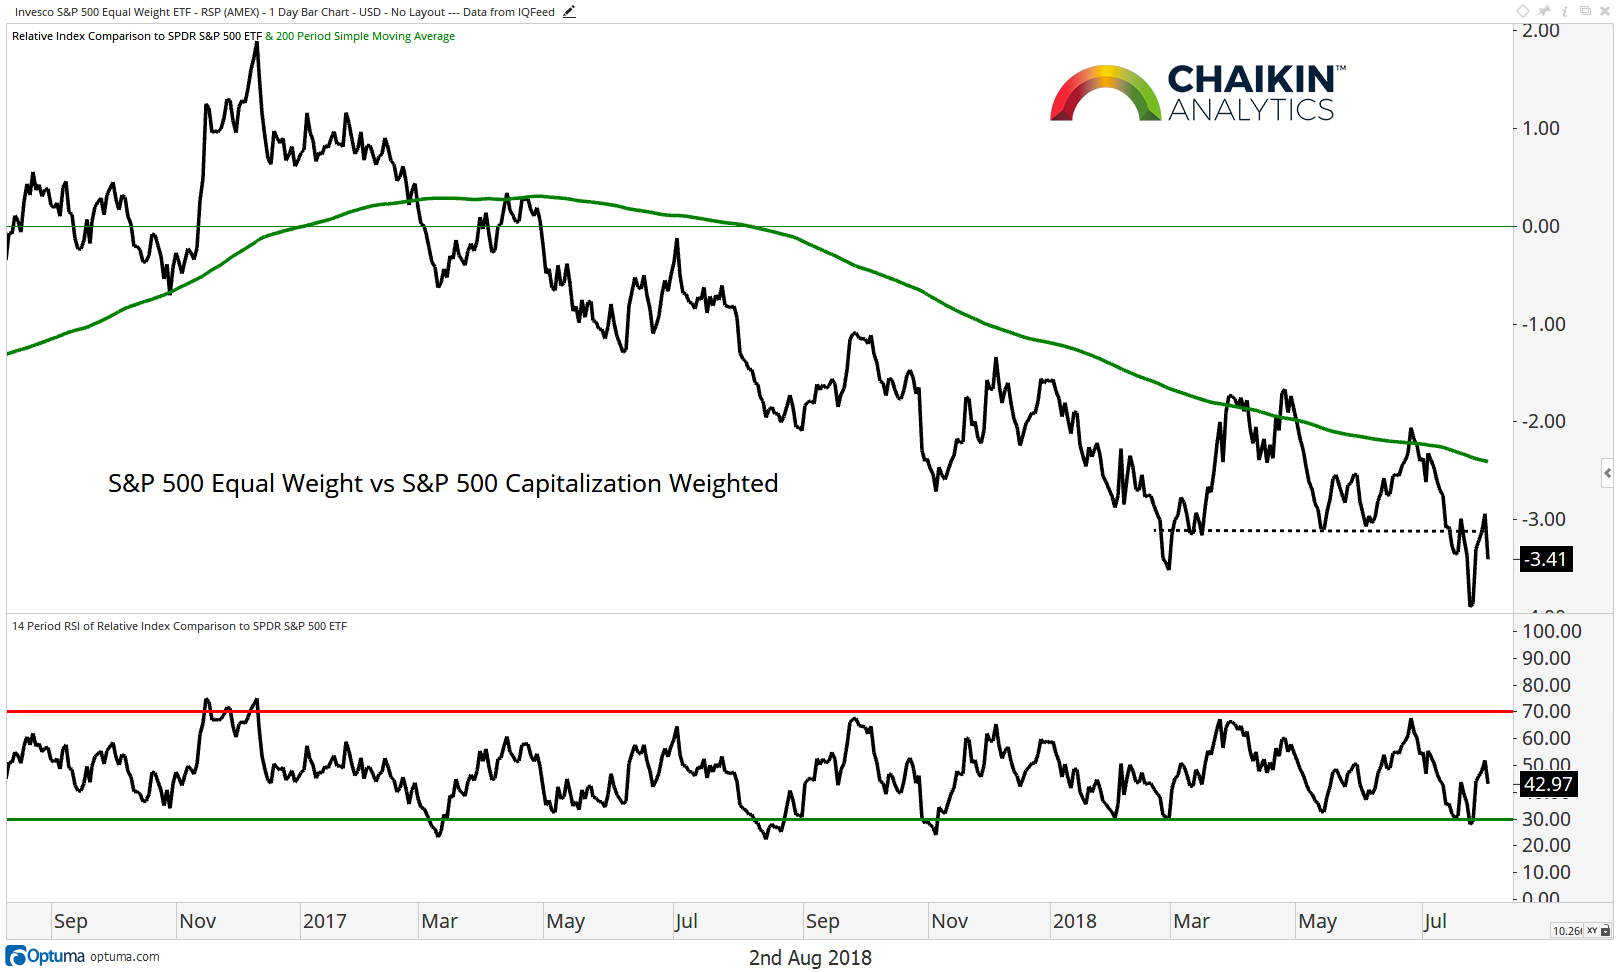
The equally weighted S&P 500 relative to the capitalization weighted S&P 500 remains below the 200-day moving average after testing the early 2018 lows.
Bulls want to see this trend reverse to signal that smaller stocks in the index are participating to the upside to the same degree or greater than the larger stocks in the index.
The Relative Strength Index (RSI) has moved off of an oversold condition but remains skewed to the bearish side.
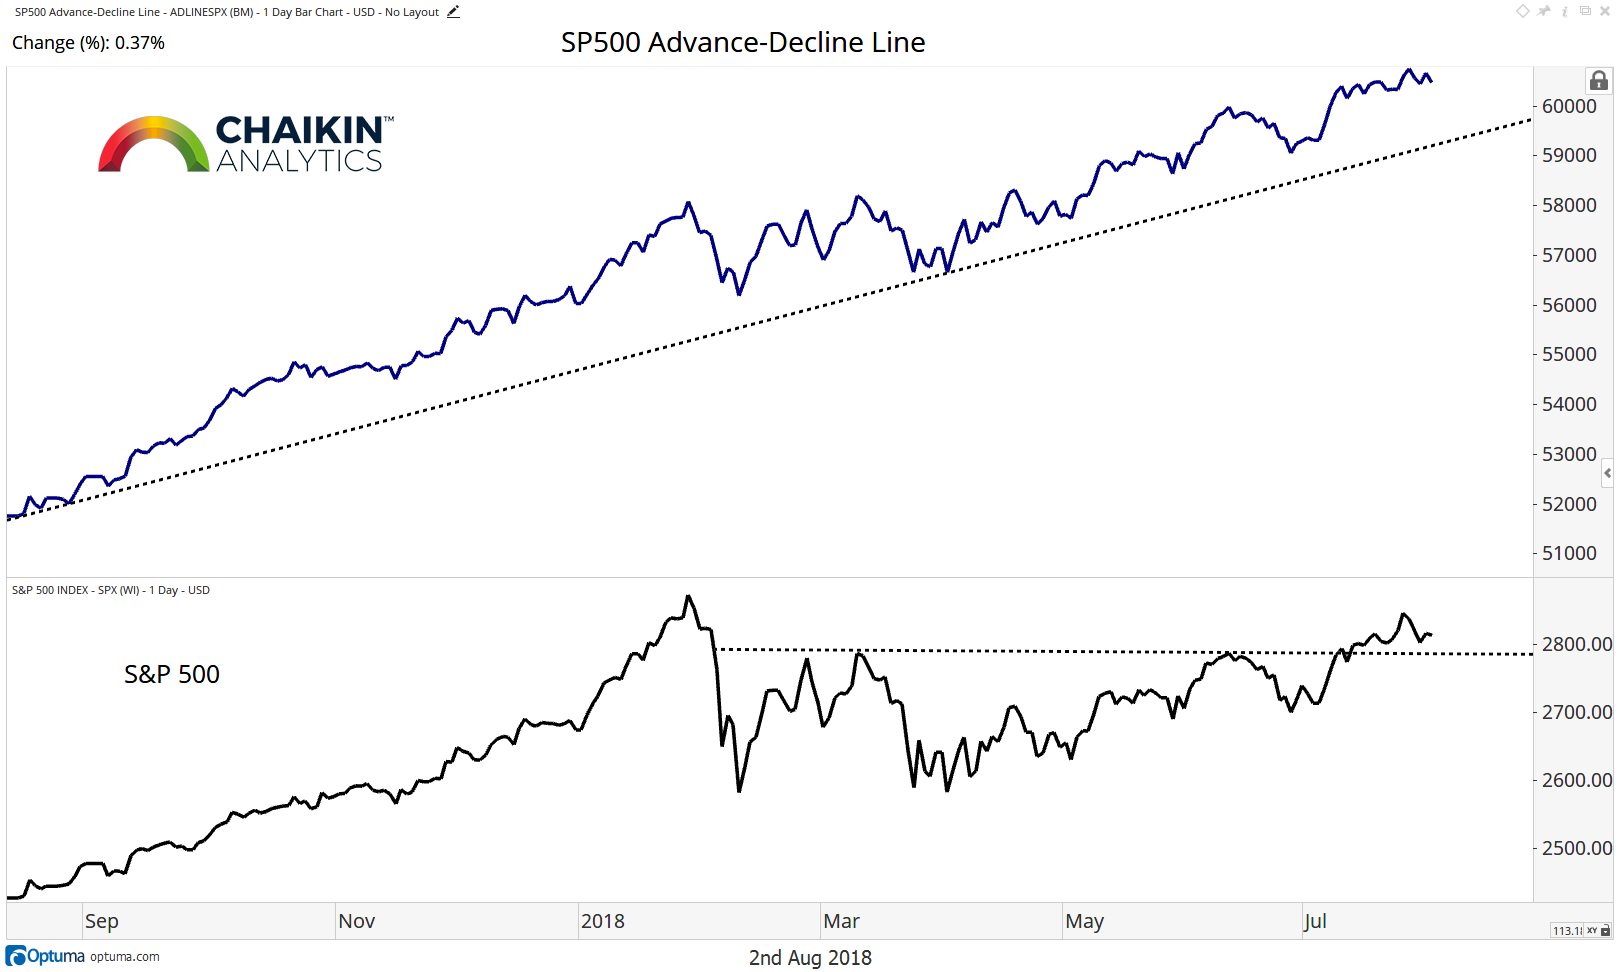
The Advance / Decline line remains in an uptrend and is close to the July 26th high. The fact that this metric remains in an uptrend points to a broad level of participation and is one of the data points behind our view that the stock market is consolidating within the secular uptrend and is likely to resolve higher.
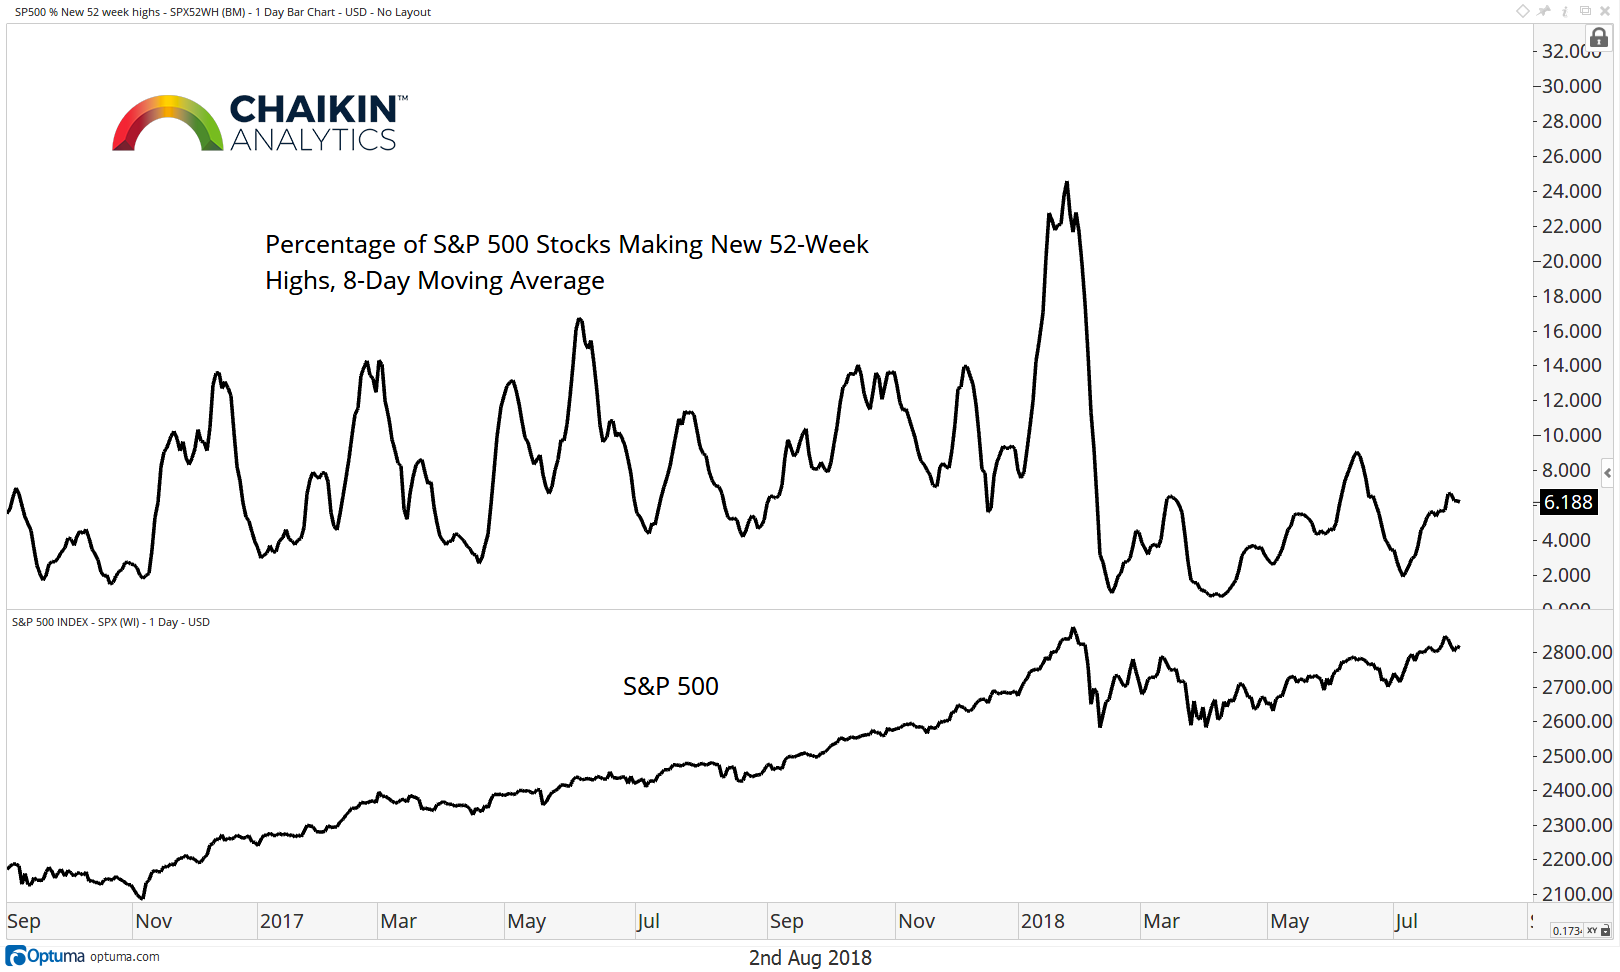
Next, we look at the percentage of stocks in the index making new 52-week highs. This is an 8-day moving average of S&P 500 stocks making new 52-week highs. This measure has moved up to 6.18% from 5.72% last week after making a slightly higher low in July. On data back to 1968, when this metric is greater than 5%, the S&P 500 is higher one quarter later (65 days) 69% of the time for a median return of 2.88%.
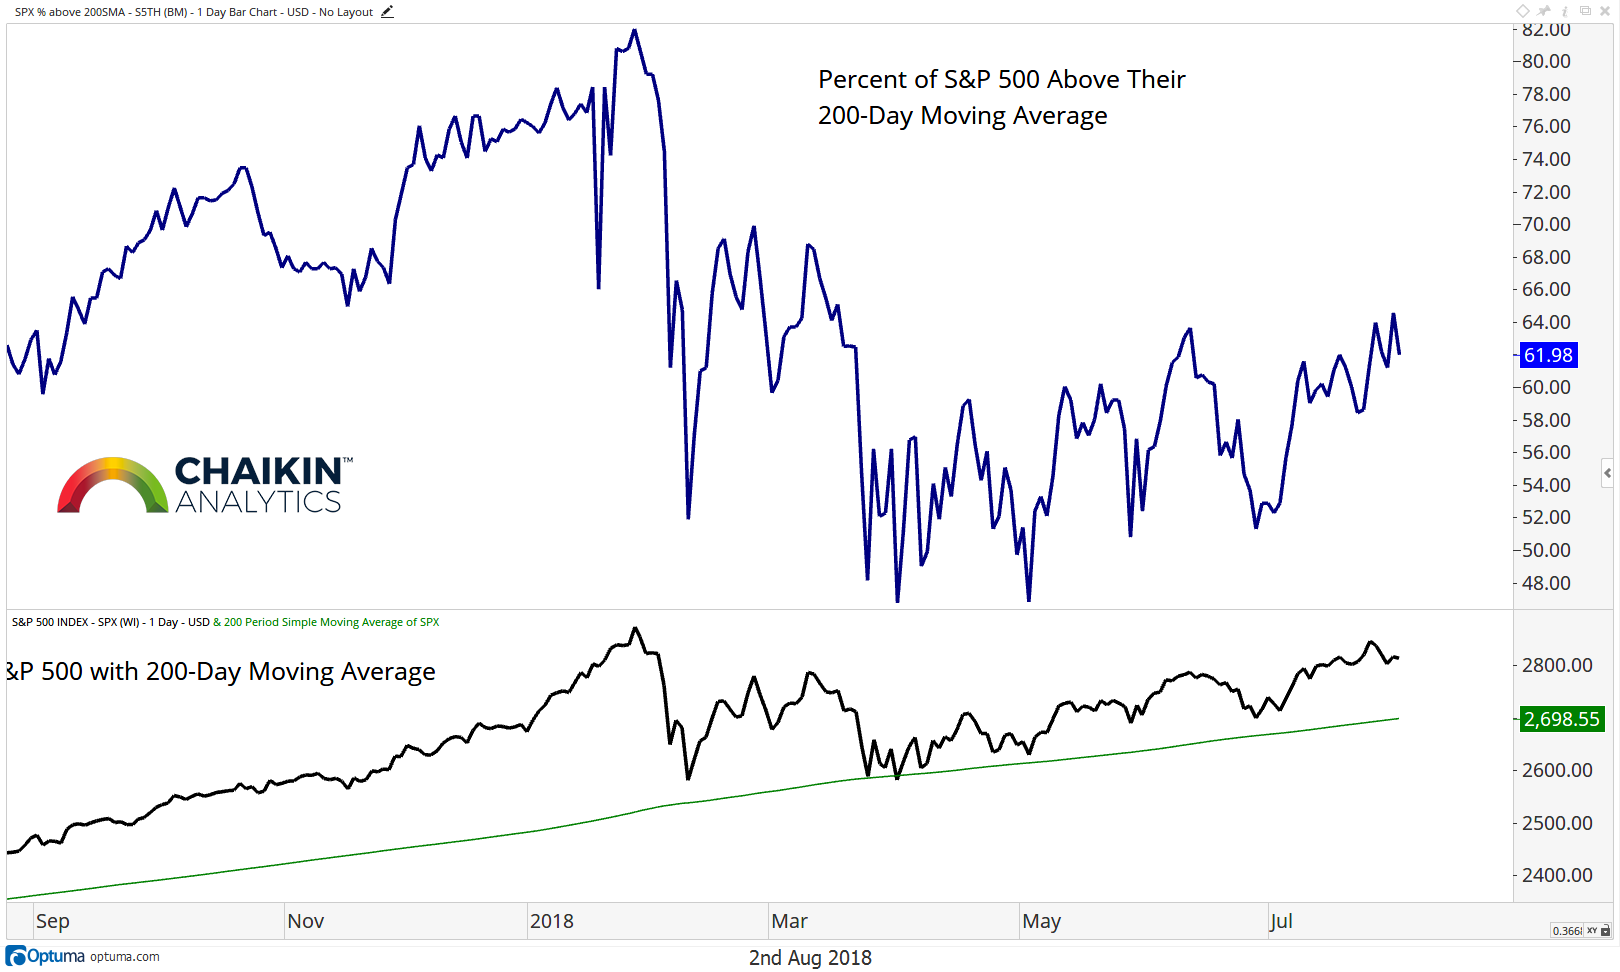
The percentage of stocks trading above their respective 200-day moving averages remains at 61%, in line with last week. When this metric is over 60%, the market is higher one quarter later (65 days) 79% of the time for a median return of 3.36% based on data back to 2010.
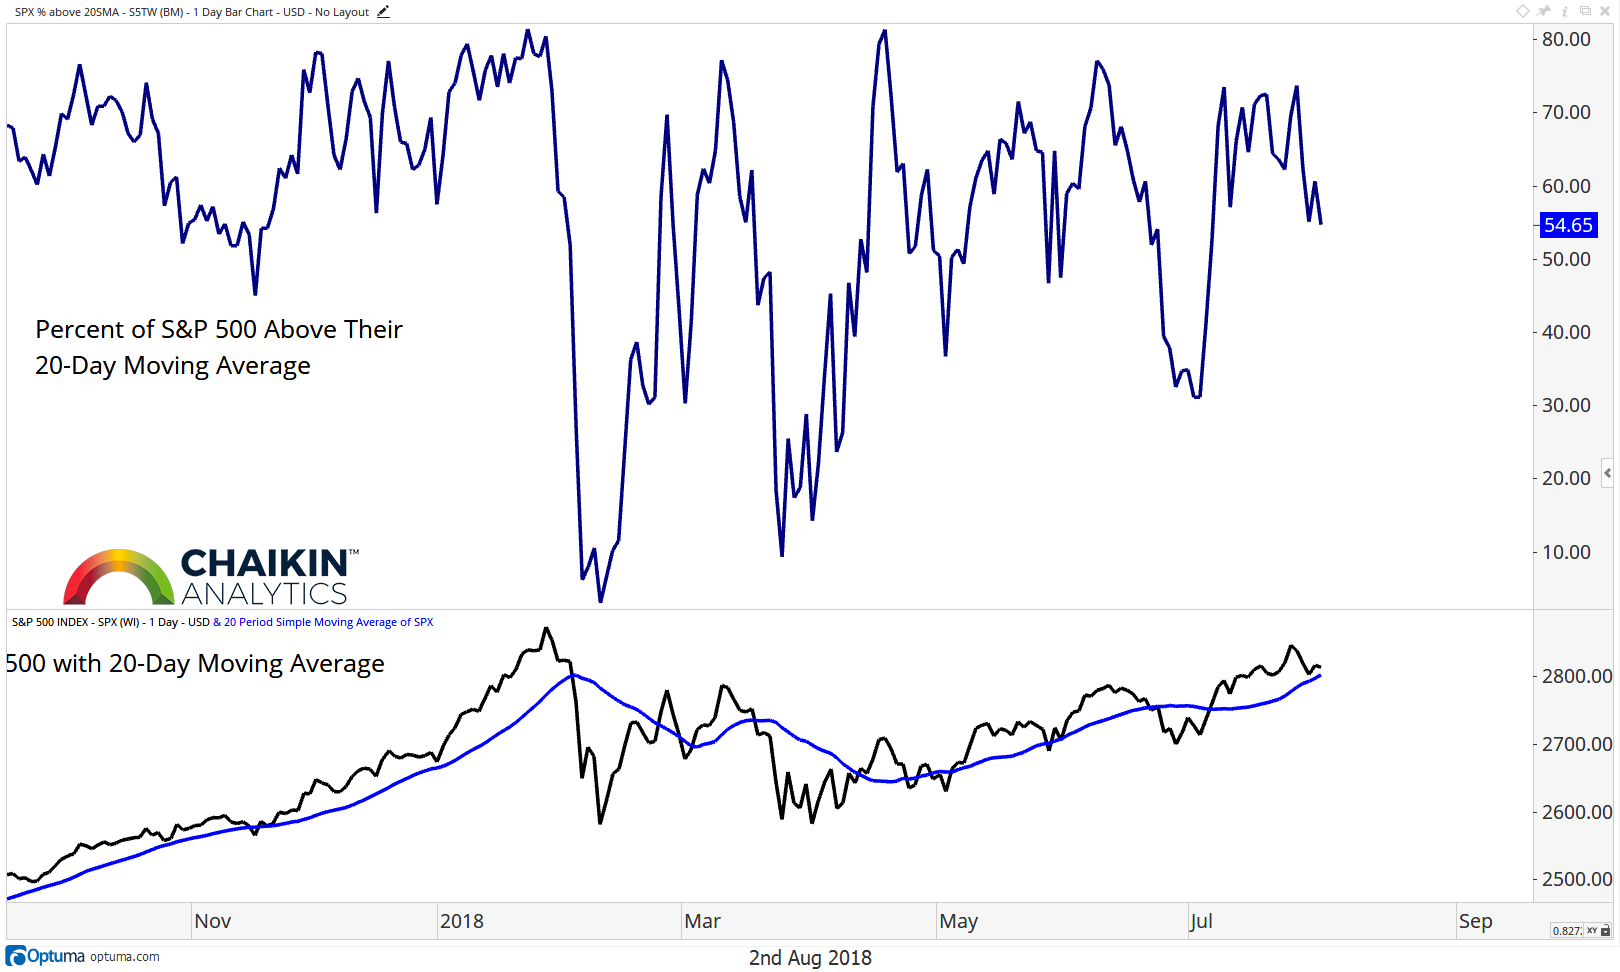
When we look at the percentage of stocks above their respective 20-day moving averages, we can see the reading has moved down to 54% from 69% two weeks ago. Since 2010, when this metric is over 50%, the S&P 500 is higher one quarter later (65 days) 77% of the time with a median return of 3.32%.
Global Market Weakness
A development which we are watching closely is the deterioration in global equity markets (outside the U.S.). At a high level, the U.S. market is the only one which remains in an uptrend.
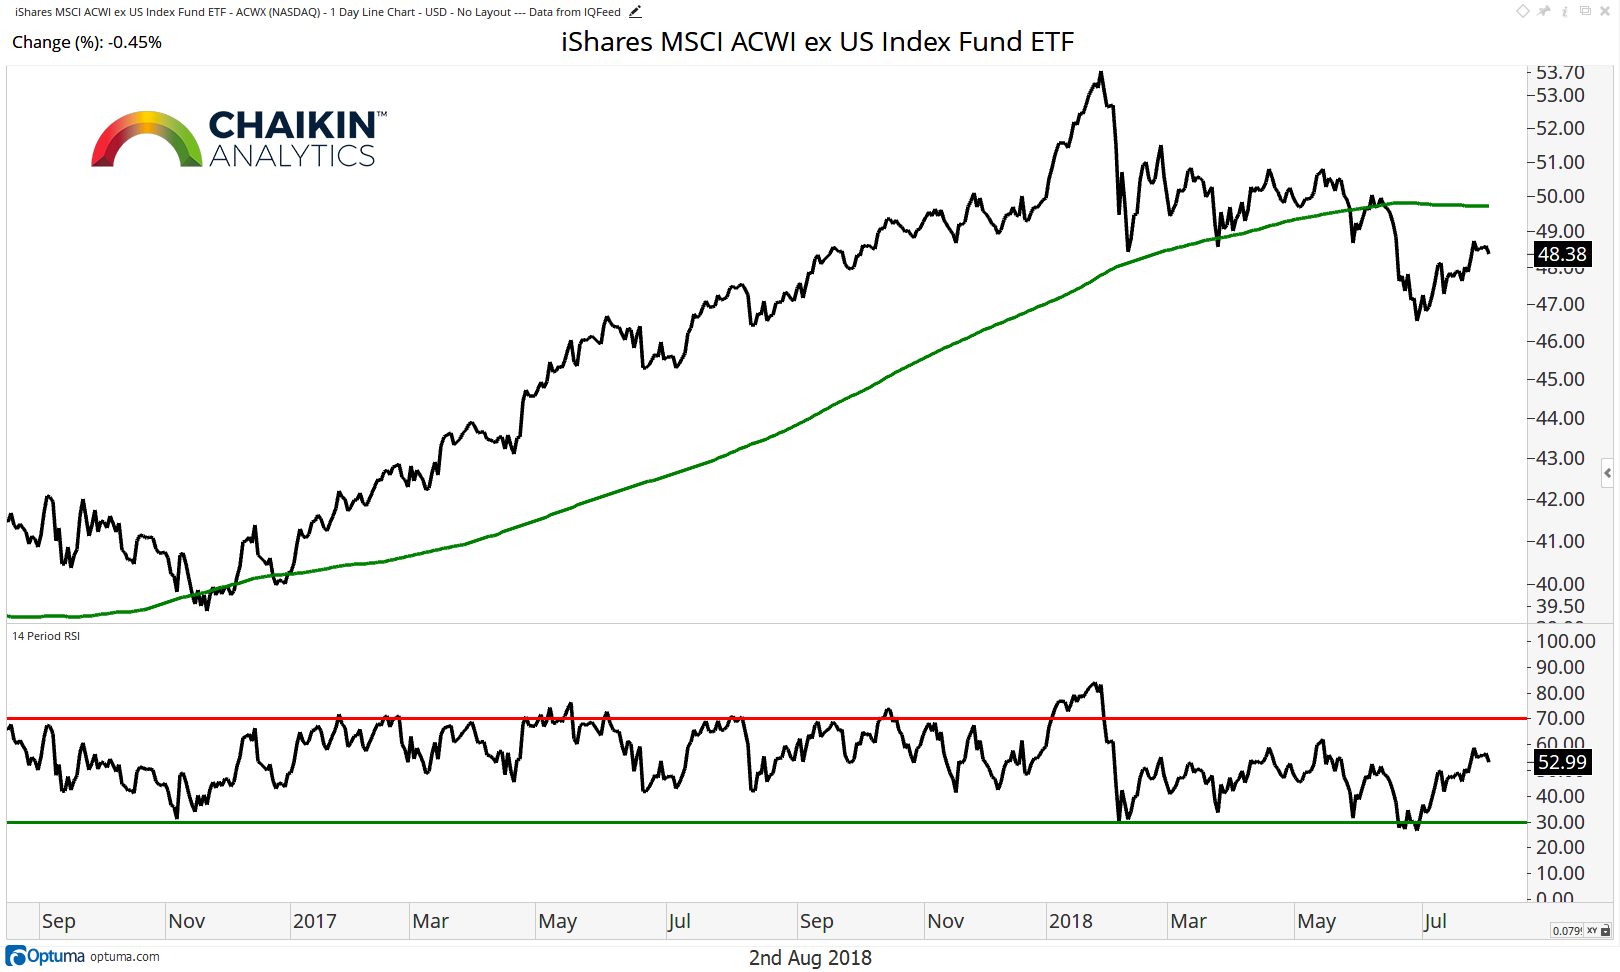
As we can see in this chart of the MSCI ACWI ex-U.S. Index Fund (ACWX), global markets have broken below the 200-day moving average after a steady uptrend. The fund has staged a counter trend rally, but we want to see a move over the 200-day moving which is confirmed by momentum before sounding the all clear. The RSI of the fund has shifted to bearish ranges and has not registered an overbought reading since early 2018.
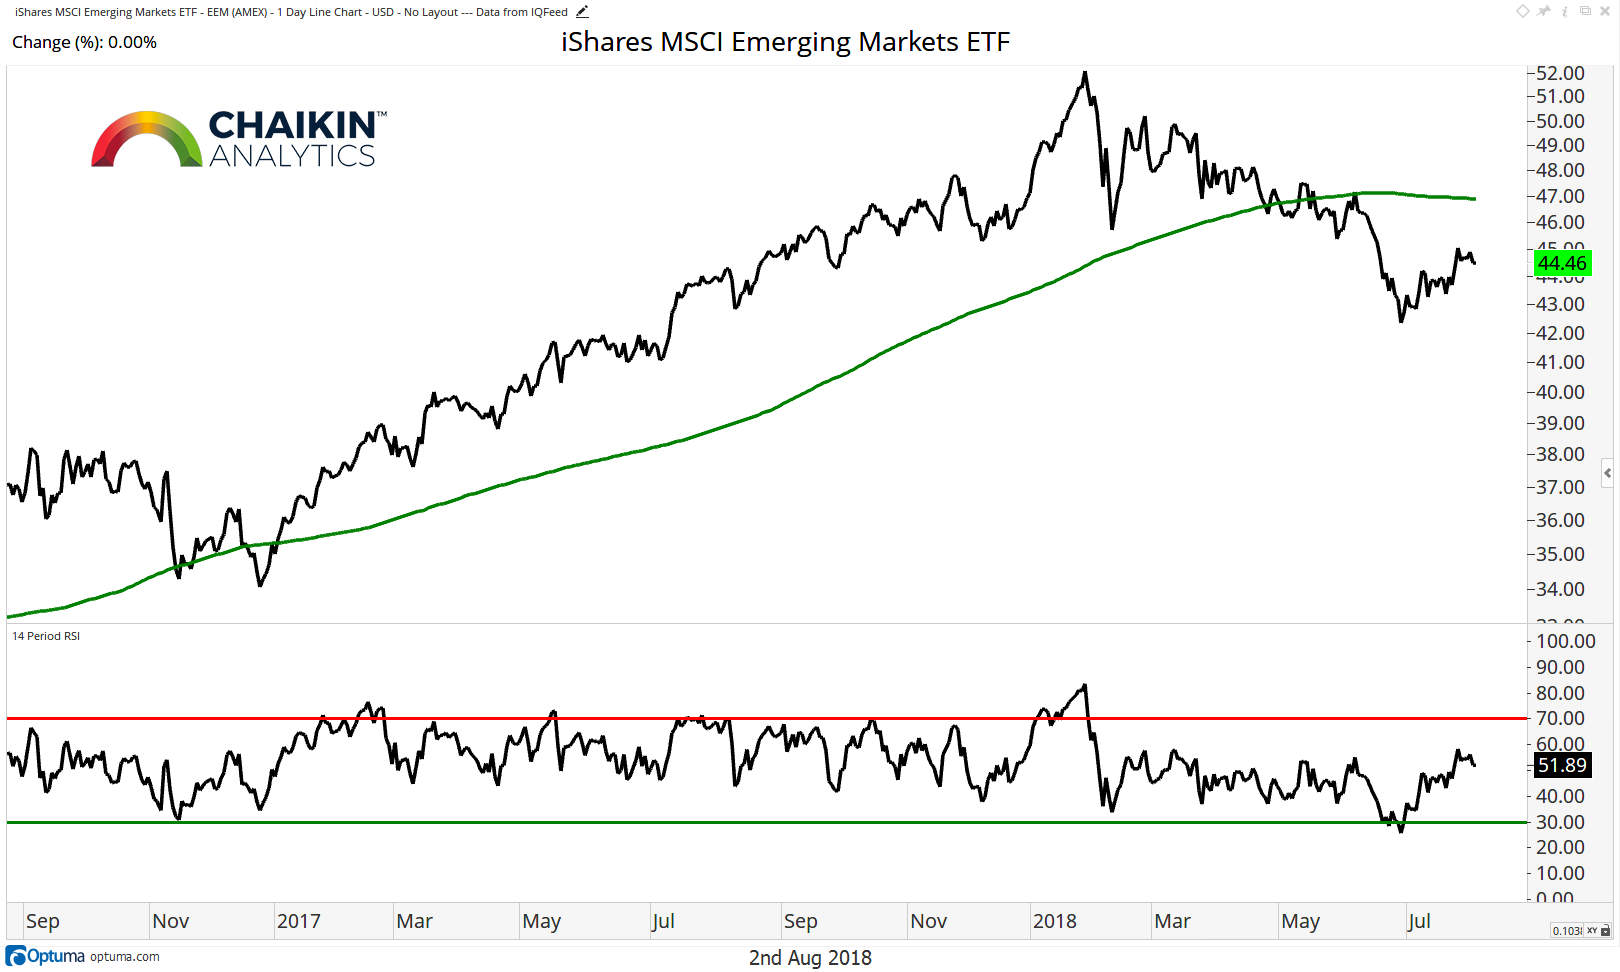
The same is true for global emerging markets as we can see with the MSCI Emerging Markets ETF (EEM). The fund has also lost its 200-day moving average and the RSI has shifted to bearish ranges.
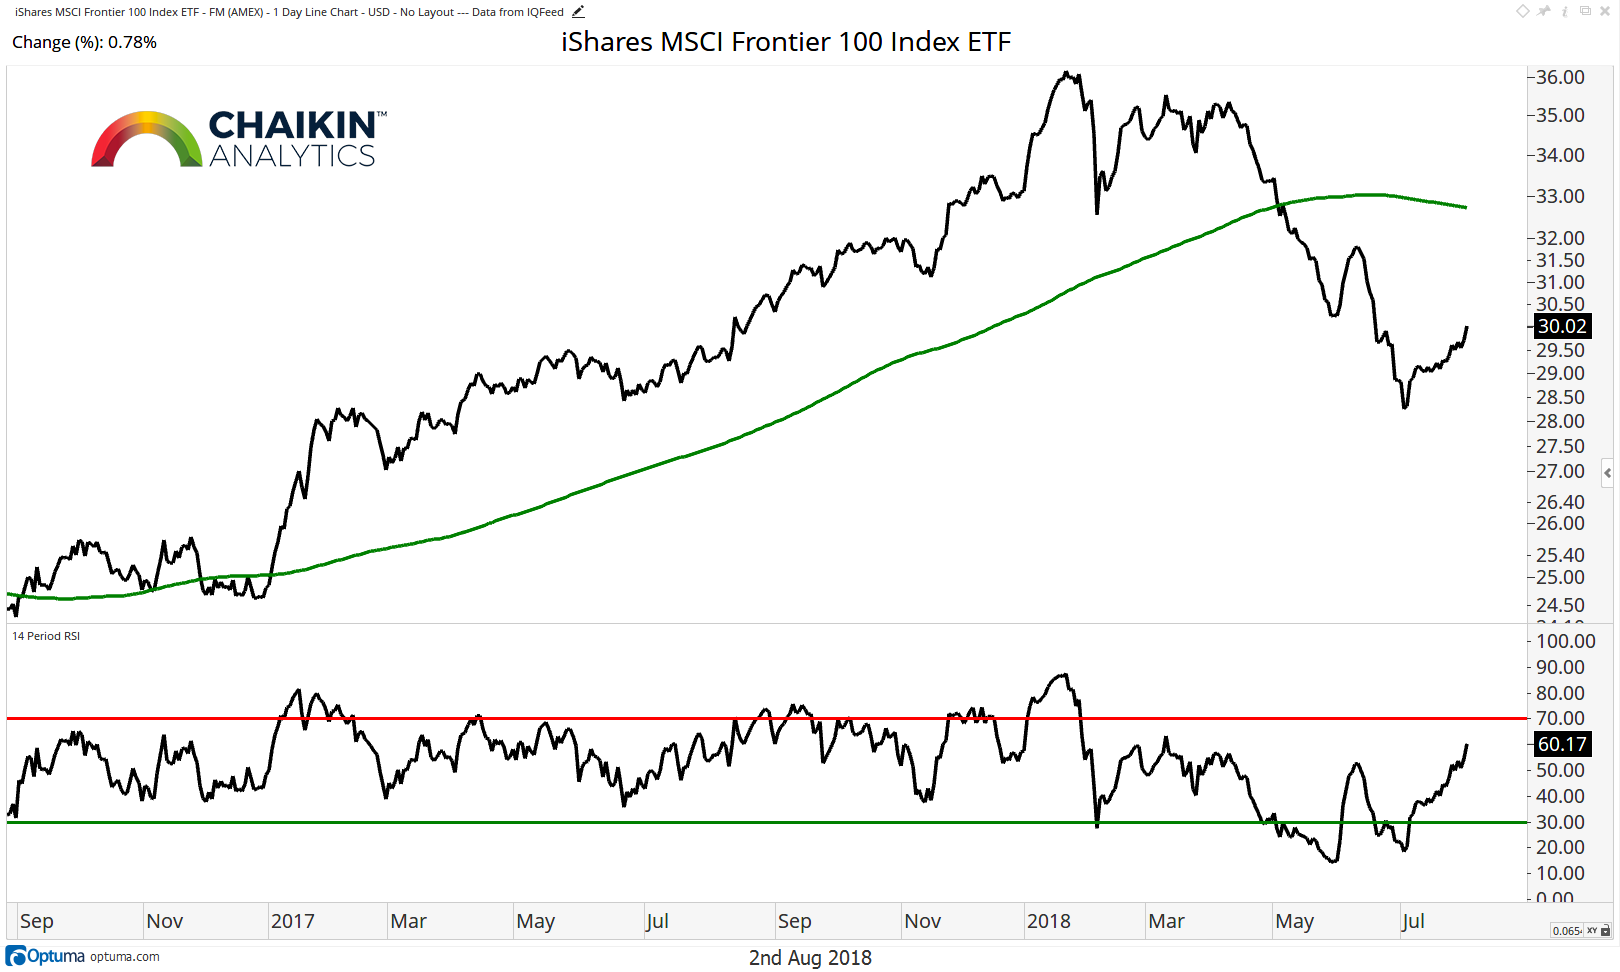
Finally, we can see greater deterioration in the MSCI Frontier 100 Index ETF (FM). The fund is below the 200-day moving average (which is now declining) and the RSI has recently registered two deeply oversold conditions which speaks to the potential strength of the recent downtrend. The current rally should be viewed as count trend in nature.
Takeaway: Most of the breadth measures which we track for the main U.S. market remain bullish even as the S&P 500 pulled back from resistance at 2,840. This supports our view that the market is likely to exit this consolidation to the upside to resume the secular uptrend which has been in place since the 2016 lows. We are monitoring the weakness in other markets around the globe for signs that it is spreading into the U.S. market. For now, that does not seem to be the case.
You can gain more insights into our methodology and stock picking over at Chaikin Analytics. Thanks for reading.
Twitter: @DanRusso_CMT
Author may have a position in mentioned securities at the time of publication. Any opinions expressed herein are solely those of the author, and do not in any way represent the views or opinions of any other person or entity.


