The debates about market breadth in the U.S. are intense, with heavy focus on the performance divergence across the indices.
Today we’ll take a closer look at that debate in the context of the global markets.
Global Markets Performance & Breadth – Key Takeaways:
- The gains in the Russell 2000 (INDEXRUSSELL: RUT) and NASDAQ 100 (INDEXNASDAQ: NDX) are global outliers
- Stock markets across the globe are offering little support to the US equity rally
- India is showing impressive strength among ‘emerging’ economies
- Resource rich countries have shown strength among developed nations
- How do we make this analysis actionable?
In the U.S. markets, most of the conversation circles back to two conversations. First, the S&P 500 and Dow Industrials relative to the NASDAQ 100 and the Russell 2000.
Second the focus is highly concentrated on Advance-Decline lines. No doubt the Advance-Decline lines are strong. There’s also no doubt that is bullish evidence. However, the market breadth discussion is incredibly narrow.
We have to put the US market strength in perspective relative to the world. Here’s a snapshot of some leading global market indices (link to a zoomed in view). There’s a few things that stand out.
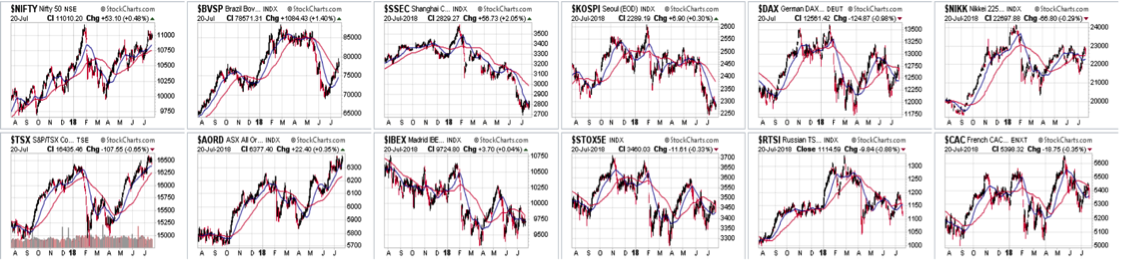
First, many major indices are 10% off the 1 year highs. Many countries around the world are at best a chopping around and parts of Asia are clearly trending lower in the intermediate term.
Second, the strength in India stands out. The Nifty 50 along with resource rich countries (late stage outperformers) Canada (TSX) and Australia (AORD) are the only noted indices in the group trading near their highs.
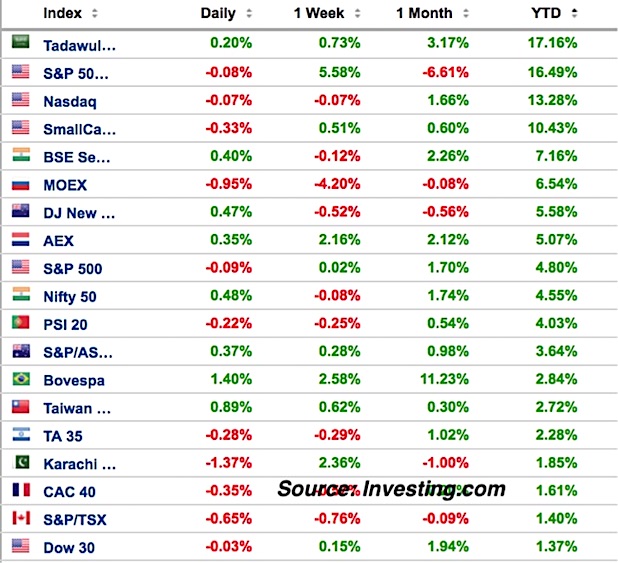
Looking at the top performing Indices Year-To-Date we see the NASDAQ 100 and Russell 2000 are global anomalies. The only other indices up 10% YTD are Saudi Arabia and S&P 500 volatility. The question is can U.S. markets continue to outperform so significantly?
So how do we make all of this analysis actionable? Well, unlike 2017, 2018 is a choppy global market environment. In choppy environments we generally want to buy weakness and sell strength at extremes. Is that what’s about to happen? Since U.S. stock market internals are strong, it’s easier to make the case for buying weakness.
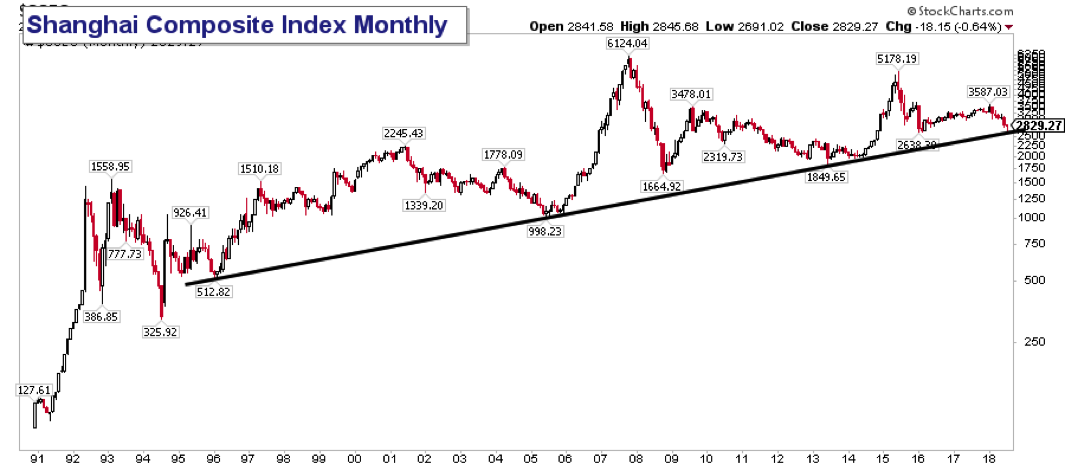
I’ll leave you with a look at the most obvious weak market in the world. The Shanghai Stock Exchange is starting to bounce off of trend support from the mid 1990’s. Do you have the guts to step into China ADRs here?
Twitter: @ATMcharts
Any opinions expressed herein are solely those of the author and do not in any way represent the views or opinions of any other person or entity.


