The past month has been chalk full of corporate earnings announcements in the U.S., and more political drama. Earnings were largely positive, but with the stock market at historically high levels, apparently something bigger than earnings growth is needed for the S&P 500 (INDEXSP:.INX) to break out above the 2400 level. And perhaps other global concerns are nagging (see commentary on Chinese money markets and economy below).
The U.S. markets are hoping for tax cuts from the Trump administration, but for now that hope seems to be sidelined as Obamacare and Russia-gate are proving to be unexpectedly difficult for the Republican administration to overcome.
Nevertheless, with employment continuing to improve in the U.S., the path of least resistance for the stock market seems to be higher, at least for the time being.
Stocks & Bonds
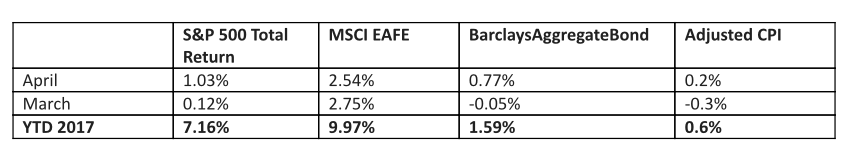
The S&P 500 continued its upward trajectory in April. However, the oil market and the bond market have diverged from the stock market in the last month, with oil prices falling and bond prices rising (bonds often sell-off when stocks are marching up). The European stock market is continuing to outperform the U.S. year-to-date, a reversal of last year’s performance. Here are the numbers:
Commodities & Currencies
Oil prices continued to lose ground in April, and for the year are now down over 8%. Gold drifted higher slightly, and is up just over 10% for the year.
The U.S. Dollar Index lost over 1% for the month, and is now down over 3% year-to-date. The market had priced in a more aggressive Fed schedule for 2017, and is now backing off of those expectations somewhat.
Economy
The ISM Manufacturing PMI in April came in at 54.8%, showing continued expansion, although somewhat slower than the previous few months. The non-manufacturing, or services, index came in at 57.5%, showing expansion at an even better pace than the preceding month. The Commerce Department released its final estimate of fourth quarter GDP growth, calculating an annual rate of 2.1%. The Commerce Department also released its preliminary estimate of growth in the first quarter of 2017. The economy grew at an annual rate of 0.7%, according to this estimate. According to the Bureau of Labor & Statistics, the unemployment rate hit a multi-year low of 4.4% last month.
The National Association of Realtors reports that existing-home sales in March 2017 were 4.4% higher than in March 2016. In addition, the median price increased 6.8% to $236,400. Median home prices have now been rising for the past 5 years. Distressed sales (foreclosures and short-sales) were 6% of total sales in March, slightly lower than in the previous month.
Commentary – Chinese Economy In Focus
There is nothing more boring than a money market. Or rather, the best case scenario is that there is nothing more boring. In 2008, one of the scariest parts of the American financial crisis was that supposedly-boring money markets were perhaps no longer safe. A money market is a cash account which is not FDIC insured, but is designed to be a safe store of value. It holds only short-term loans (30 days or less) of the highest quality. In other words, it is boring, because everyone wants it to be boring.
So when money market rates spiked in China in the last few days, it is a reminder that despite the continued economic recovery in the U.S., there remain abundant risks.
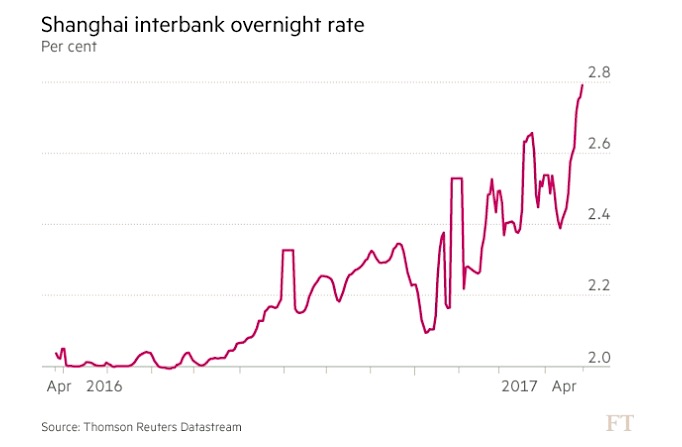
In China, the leaders are worried that debt-fuelled growth has gone too far, and too fast. At different times, they have tried to ‘let the air out of the balloon’ slowly, but this is a difficult task. They recently announced new regulations designed to clamp-down on the most risky types of new loans – and money market rates spiked. That is worrisome not because the new regulations affected interest rates – they were intended to affect interest rates. But they were intended to affect only the most high-risk type of financial instruments – why would boring old money markets react so strongly? The clues, unfortunately, point to a financial system that is simply over-extended.
This might be less noteworthy if it were happening in Slovenia – but China is one of the world’s largest economies, and arguably its biggest engine for growth. While the U.S. and Europe struggle with aging populations, historic debt, and low-single-digit economic growth, China’s economy is roaring along at 6-7% annual growth. Most economists estimate that up to a third of the globe’s economic growth is due to China. So the old saying that ‘if the U.S. sneezes, the rest of the world catches cold,’ could easily and accurately be transferred to China.
To be clear, the increased money market rates in China are not a crisis – but they are an interesting data point and something to watch. Thanks for reading.
This material was prepared by Greg Naylor, and all views within are expressly his. This information should not be construed as investment, tax or legal advice and may not be relied upon for the purpose of avoiding any Federal tax liability. This is not a solicitation or recommendation to purchase or sell any investment or insurance product or service, and should not be relied upon as such. The S&P500, MSCI EAFE and Barclays Aggregate Bond Index are indexes. It is not possible to invest directly in an index. The information is based on sources believed to be reliable, but its accuracy is not guaranteed.
Investing involves risks and investors may incur a profit or a loss. Past performance is not an indication of future results. There is no guarantee that a diversified portfolio will outperform a non-diversified portfolio in any given market environment. No investment strategy can guarantee a profit or protect against loss in periods of declining values. Listed entities are not affiliated.
Data Sources:
www.standardandpoors.com – S&P 500 information
www.msci.com – MSCI EAFE information
www.barcap.com – Barclays Aggregate Bond information
www.bloomberg.com – U.S. Dollar & commodities performance
www.realtor.org – Housing market data
www.bea.gov – GDP numbers
www.bls.gov – CPI and unemployment numbers
www.commerce.gov – Consumer spending data
www.napm.org – PMI numbers
www.bigcharts.com – NYMEX crude prices, gold and other commodities
https://www.ft.com/content/2e513fbe-2b23-11e7-bc4b-5528796fe35c – chart on Shanghai money market rates
Any opinions expressed herein are solely those of the author, and do not in any way represent the views or opinions of any other person or entity.

 Trading Near Top Of Price Range")


