The stock market continues to celebrate tax reform, as corporations are starting to release improved earnings due to reduced tax bills.
The financial markets are hungrily anticipating and receiving share buybacks to accompany improved earnings.
But at the same time, central banks are shifting into slowdown mode. The Federal Reserve is increasing its monthly bond sales from $10 Billion to $20 Billion this month. The European Central Bank is reducing its bond purchases from 60 Billion Euros per month to 30 Billion Euros per month.
In terms of gross numbers, the Federal Reserve is removing $420 Billion of stimulus from financial markets this year, while tax cuts will add less than $150 billion to corporate earnings.
Stocks & Bonds
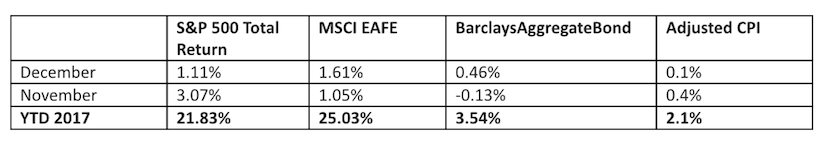
The stock market finished the 2017 on a high note, but no one really knew exactly how excited investors would be come January 1st. Bond holders saw gains in 2017 but 2018 hasn’t been so nice to the bond market thus far. A weaker dollar continues to provide a tailwind for stocks and earnings. It remains to be seen, though, if central bank tightening will have any effect. Here’s 2017 by the numbers:
Commodities & Currencies
Oil prices experienced a nice year-end rally to 2017 and are making multi-month highs in January. Gold is also performing well, building on 2017, which saw gold gain 13.42%. The US Dollar was down nearly 10% in 2017 and that theme has continued into 2018. Weak dollar = strengthening commodities.
Economy
A quick review of some year-end numbers…
The ISM Manufacturing PMI in December was 59.7%, higher than November, and continuing to show healthy economic expansion. The non-manufacturing, or services, index came in at 55.9%, also showing continued strong expansion. The Commerce Department released its third estimate of third quarter growth, estimating that the economy grew at an annual rate of 3.2%.
From the author: This material was prepared by Greg Naylor, and all views within are expressly his. This information should not be construed as investment, tax or legal advice and may not be relied upon for the purpose of avoiding any Federal tax liability. This is not a solicitation or recommendation to purchase or sell any investment or insurance product or service, and should not be relied upon as such. The S&P500, MSCI EAFE and Barclays Aggregate Bond Index are indexes. It is not possible to invest directly in an index. The information is based on sources believed to be reliable, but its accuracy is not guaranteed. Investing involves risks and investors may incur a profit or a loss. Past performance is not an indication of future results. There is no guarantee that a diversified portfolio will outperform a non-diversified portfolio in any given market environment. No investment strategy can guarantee a profit or protect against loss in periods of declining values. Listed entities are not affiliated.
Data Sources:
- Standard and Poors information
- MSCI EAFE information
- Barclays Aggregate Bond information
- Bloomberg – U.S. Dollar & commodities performance
- Realtor.org – Housing market data
- BEA.gov – GDP numbers
- BLS.gov – CPI and unemployment numbers
- Commerce.gov – Consumer spending data
- napm.org – PMI numbers


 Showing Bullish Buy Potential")


