This article takes a unique perspective on the global earnings cycle, looking at the proportion of countries seeing expansion or contraction in earnings and economic activity. The charts come from the 2016 End of Year Special Edition (one-off free download).
The key finding is that the post-global financial crisis environment has been unusually weak, but there is a silver lining…
View from the top: The highest level view of the global earnings cycle
The first chart looks at the breadth of the current global earnings cycle. More specifically, and of importance now, is how many countries (out of the 47 included in the study) saw a year on year contraction in forward earnings. The first obvious point from looking at the chart is that this indicator spikes when there is a global recession or crisis e.g. the Asian financial crisis, the global recession in the early 2000’s, the global financial crisis, and more recently the Eurozone crisis, and commodity collapse.
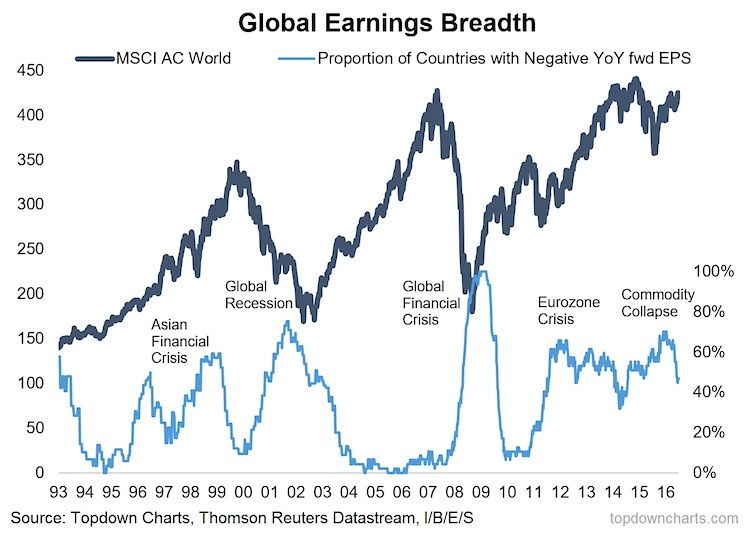
This is important because it in effect works as a confirming indicator that a bottom is in (the market usually bottoms during a crisis or recession). But the other notable aspect is how since the global financial crisis the indicator has spent most of its time above 50% i.e. at least half the countries saw contracting forward earnings (in contrast to the period prior to the crisis!).
That silver lining I promised comes when you notice it made a post-crisis peak at 70% at the end of last year and is now down to “only” 47%, and it’s far from being stretched to the down side (which can sometimes serve as a contrarian signal).
The next chart shows a similar metric, but this time looking at industrial production growth. It shows the same economic malaise persisting post-crisis, with at least a third of countries seeing industrial production contracting over the past 5 years. (33%, 45% Eo15)
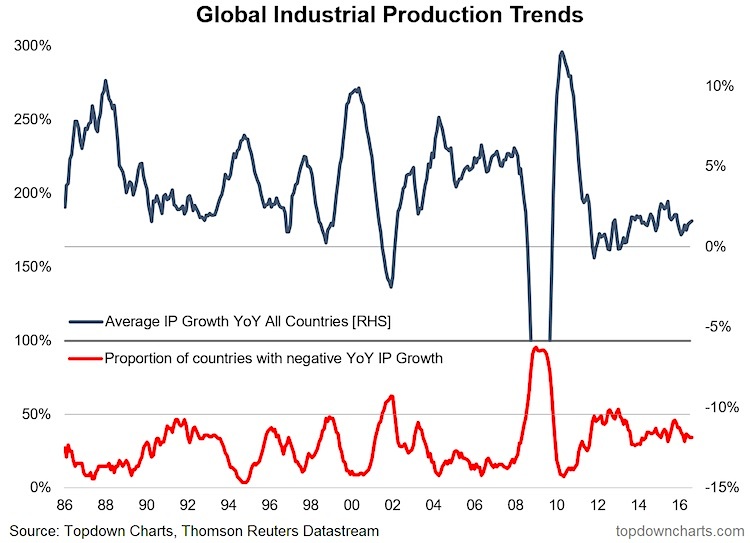
Again, the silver lining is the indicator peaked at 45% at the end of last year and has fallen to “only” 33% and global average industrial production growth is starting to improve (in line with improving manufacturing PMIs).
Taking a breadth view on global earnings and economic activity growth can reveal some important patterns for assessing the global earnings cycle and helping with medium term timing of exposure to global equities. The latest trends in the indicators show improvement and confirmation of the market bottom last year for global equities.
Thanks for reading.
Twitter: @Callum_Thomas
Any opinions expressed herein are solely those of the author, and do not in any way represent the views or opinions of any other person or entity.


