As we turn the page to a new month (January) and a new year (2019), we are tasked with assessing the damage from the December whoosh lower. And the risk that remains as we move forward.
The most likely outcome is a retest (or undercut) of the December lows. But that can only happen when this rally runs out of gas. Note that I discussed some upside targets for the S&P 500 (NYSEARCA: SPY) in my previous article.
Clearly, it will be important to watch the price action on the next stock market decline.
Some questions in that regard include:
Will we get a momentum divergence (new lows in price but no new lows in RS momentum)? Will key fibonacci levels hold? Will cyclical sectors perk up? Will oil show some strength?
These are all important “market tells” and will be on my mind as January takes shape and the correction unfolds… but one “tell” that bears watching is the performance of the high beta stocks such as small cap stocks and tech stocks. Especially on the next turn lower / decline.
Just as the Russell 2000 (NYSEARCA: IWM) and the Nasdaq Composite (INDEXNASDAQ: .IXIC) tipped off the decline and lead the market lower, it should lead us higher.
This is as easy as watching the Russell 2000 and the Nasdaq Composite. What investors would like to see is one (or both) of those indexes show relative strength on the next decline. That would include a higher low or relative strength versus the broader S&P 500.
Should the market decline swiftly again (to new lows), then this could also come by way of an early turn higher in small caps and/or tech stocks. Put it on your radar.
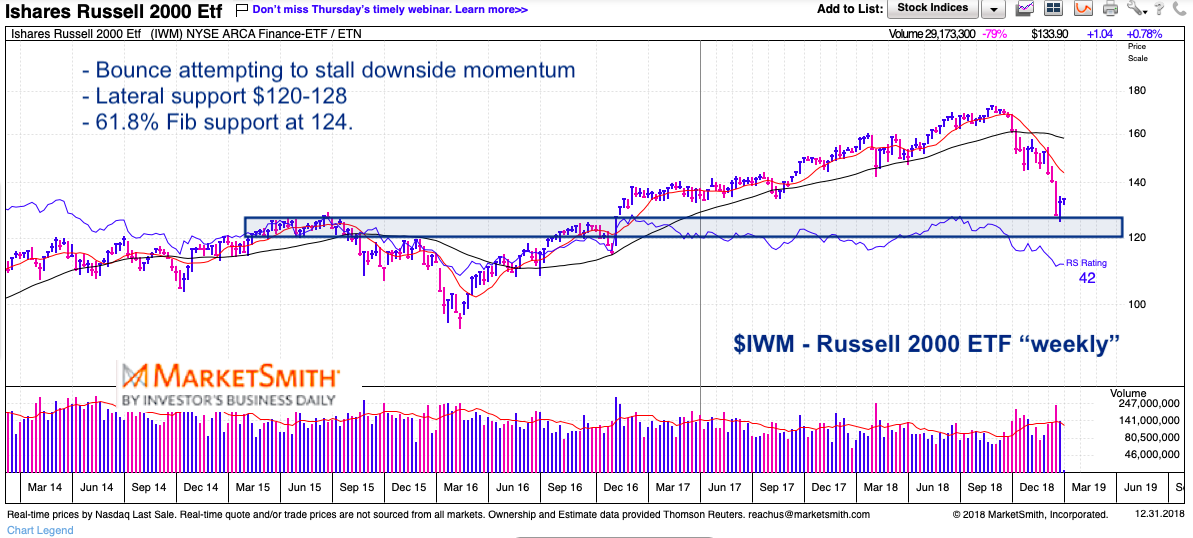
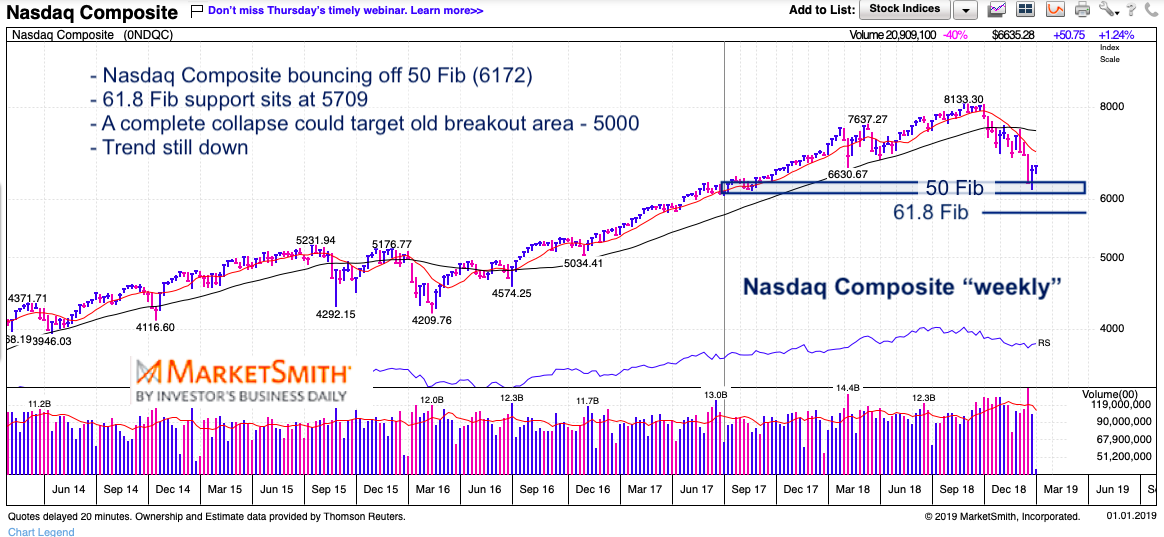
Let’s look at the chart below for some price areas of interest on the the Russell 2000 and Nasdaq Composite.
Note that the following MarketSmith charts are built with Investors Business Daily’s charting suite. I am an Investors Business Daily (IBD) partner and promote the use of their products. The entire platform offers a good mix of technical and fundamental data.
Russell 2000 “weekly” chart
Nasdaq Composite “weekly” Chart
Trade safe and have a plan that follows your given timeframe.
Twitter: @andrewnyquist
The author does not have a position in mentioned securities at the time of publication. Any opinions expressed herein are solely those of the author, and do not in any way represent the views or opinions of any other person or entity.


