I was chatting with Andy Nyquist, SeeItMarket founder, earlier this week. I mentioned that my first post to the site was over 6 years ago, opining on the energy markets. So why not pop my head in on the same topic today.
Of course, everyone has seen what is going on in the energy and commodities arenas in the last several months, but a recent turn of events may cause a broader stir.
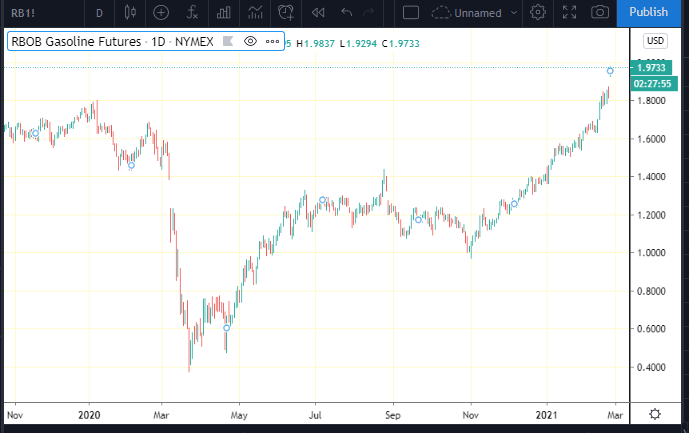
Gasoline futures have doubled from their low in early November – moving from under $1 to nearly $2 at the wholesale level. Consumers are sure to have noticed already. Higher pump prices are likely on the way as a $2.00 RBOB gasoline price implies a national retail average pump price of $2.80 in the coming weeks. Many cities will be above $3 if they aren’t there already.
It was a year ago when risky assets, including gasoline, sold off hard in response to the COVID-19 pandemic. It was a slow, but steady recovery from Q2 through last summer, but the major upside has taken place just in the last 4 months.
Why the sudden surge? A few things. A falling US Dollar benefits commodities, but the market also transitioned to the more expensive summer-blend as the April contract took over as the prompt-month. Money moving into energy stocks and the value style is a secondary driver, too.
Investors have slowly been increasing expectations for a huge GDP print this year; the best since 1984, potentially. Goldman Sachs predicts 7.0% real economic growth while Bank of American recently revised their forecast to 6.5%. These are big numbers. Much higher demand for gasoline appears imminent.
Here’s the chart of RBOB. Notice the recent rally – right as white-collar workers begin the transition back to the office.

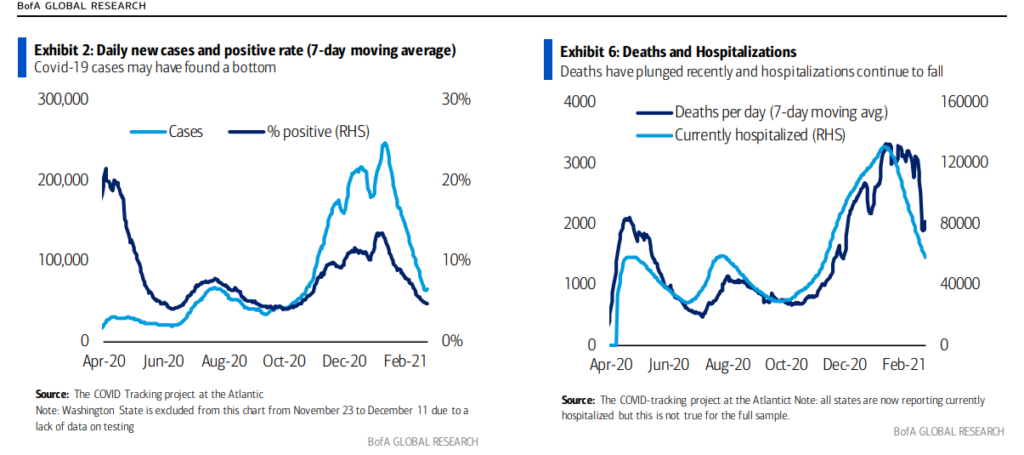
COVID-19 cases are down sharply from the early January peak while hospitalizations are also markedly below the peak less than two months ago. It’s just a matter of time until consumers feel the pinch for real as restrictions and precautions continue to ease.

Maybe you’re like me and haven’t ventured out of the house (and home office) much in the last year. My odometer is up only about 2,500 miles year-on-year at last check. My gasoline expense hasn’t been this low .. well.. ever. I know it won’t last, but at the same time, I kind of look forward to heading back to the office to be around my peers again.
In the meantime, I’ll use my gasoline budget savings on some steak!
Mike Zaccardi is an adjunct finance instructor at the University of North Florida, as well as an investment writer for financial advisors and investment firms. He’s a Chartered Financial Analyst and Chartered Market Technician, and has passed the coursework for the Certified Financial Planner program. Follow Mike on Twitter @MikeZaccardi, connect with him via LinkedIn.
I am a Chartered Financial Analyst (CFA) and Chartered Market Technician (CMT). I have passed the coursework for the Certified Financial Planner (CFP) program. I look to leverage my skills in a consultant role for financial advisors – that could be portfolio analysis, planning, writing etc. Please reach out to me at mikeczaccardi@gmail.com for more information. Connect on Linkedin.
Twitter: @MikeZaccardi
The author may hold positions in mentioned securities. Any opinions expressed herein are solely those of the author, and do not in any way represent the views or opinions of any other person or entity.


