Thursday morning April 20, I began the day with the crew at the Benzinga PreMarket Prep show.
We (Joel and Mitch) covered a lot.
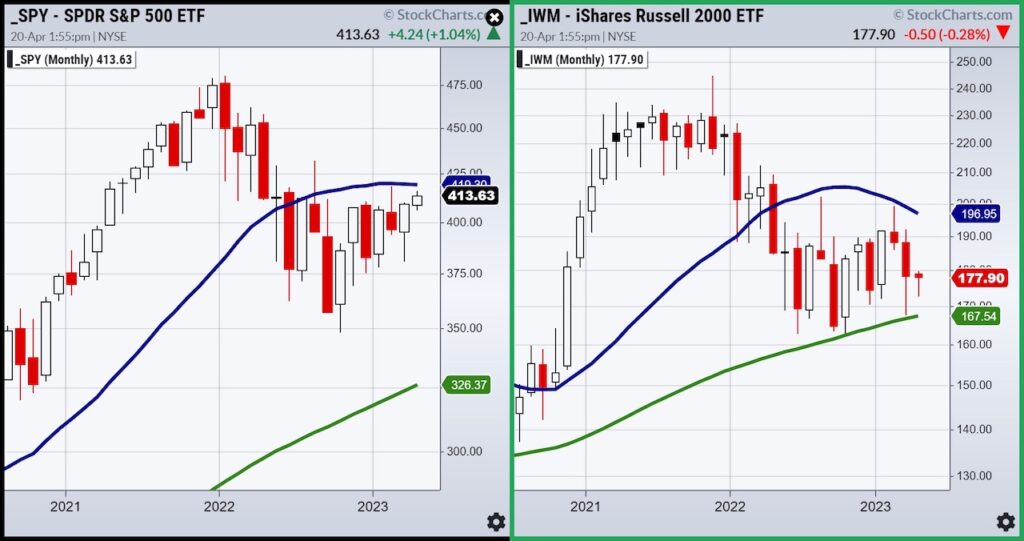
The focus remains this persistent, rangebound market.
I use many different moving averages consistently through the years. This year, the monthly moving average is designed for this market environment.
In fact, next week as we head to the Money Show in Las Vegas, I will be teaching attendees how this moving average has already made us a lot of money this year.
This moving average has been quite extraordinary.
Furthermore, we cover why we are still concerned about inflation versus recession, or more aptly put, stagflation.
Our conversation, along with the charts you’ll see, should help you gain an edge in your trading.
Stock Market ETFs Trading Analysis & Summary:
S&P 500 (SPY) Tight range to watch this week 410-415 on a closing basis
Russell 2000 (IWM) 170 support- 180 resistance
Dow Jones Industrial Average (DIA) Over the 23-month MA 336-support to hold
Nasdaq (QQQ) 312 support over 320 better
Regional banks (KRE) 44 now pivotal resistance
Semiconductors (SMH) 258 resistance with support at 248
Transportation (IYT) Still under the 23-month MA with 232 resistance 224 support
Biotechnology (IBB) 130 major pivotal area-135 resistance
Retail (XRT) 58- 64 trading range to break one way or another


