By Andrew Nyquist It’s been a little while since I posted some technical analysis on specific stocks. As many readers and followers know, I don’t just post about stocks or markets that I like; I post technical analysis on stocks and markets that I think readers want to see (or are important for readers to see). As well, I always try to educate investors indirectly on how one should approach trade setups (or investments) through a risk management lens. That said, I thought it would be good to revisit Fusion-io (FIO), a small cap darling of the past.
Can Fusion-io regain its small cap darling status?
Considering that Fusion-io’s stock is down about 15 percent year-to-date, and just under 50 percent from its 2012 highs, most investors are probably rolling their eyes… or steaming mad that the stock has performed so poorly of late. Seriously, it was just 5 months ago that the stock was $32 and flying high. But considering it is deeply reliant upon strategic customers Facebook (FB) and Apple (AAPL), and business is said to be slowing with both, the stock is in pain. The collapse of Apple’s stock price, and reasons behind it, have probably hit Fusion-io the hardest. Worries about margins/suppliers/growth with one of your biggest strategic customers (and watching that stock get decimated) tends to make investors cover up. But Fusion-io has been working to diversify its business for some time. And it will be this progress, or lack there of, that investors watch for in upcoming financial reports and news.
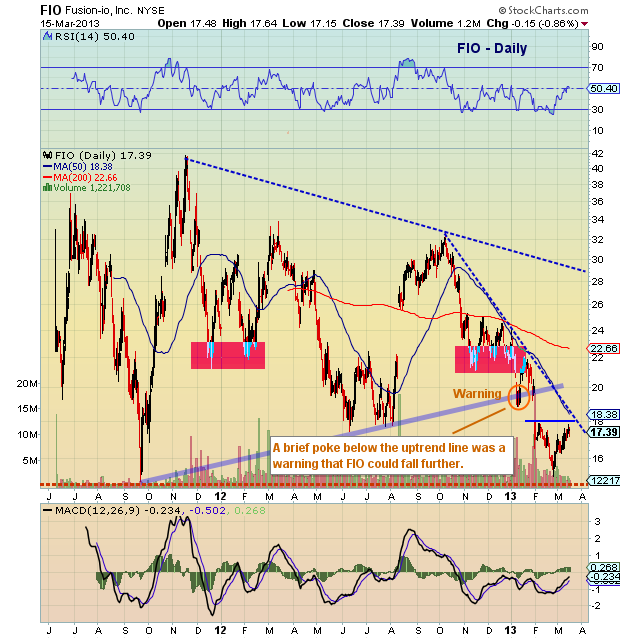
That said, let’s turn to the Fusion-io stock chart for a technical update. Current prices find FIO near the bottom of its 2 year range. The stock is hovering below its immediate downtrend line and sitting just under a cluster of lateral resistance around $18. The stock’s real problems began when it couldn’t break above the downtrend line in December, and then failed to hold $21 support (pink shaded). This lead to an ominous poke below its macro uptrend line (light blue solid), which was a warning for yet another collapse (it’s gap below the macro uptrend line).
So what needs to happen to elicit more interest from traders (or investors). Well, let’s back up a few weeks… the stock bounced out of oversold status on a DeMark weekly buy setup. This created a mini “V” pattern. This is neither bullish or bearish, but worth watching. Why? Well, a gap higher could create an “island.” And this would give the stock a glimmer of bottoming hope. Second, a break of the immediate downtrend line and 50 day MA could set up a backtest of the prior macro uptrend line ($20-$21). One step at a time. But, until then, the ball is firmly in the bear’s court.
Trade safe, trade disciplined.
Twitter: @andrewnyquist and @seeitmarket
No position in any of the mentioned securities at the time of publication.
: Worrisome to Broader Market?")

: Important Breakout Retest")
