November options expiration lands on Friday, November 20 this year. Historically, the two weeks that follow have been one of the more consistent stretches on the calendar for U.S. stocks. Consistent is not the same as large, though, and the difference matters if you plan to lean on the pattern.
Here is what the last 20 years show, using SPY, QQQ and IWM with split- and dividend-adjusted daily closes, close to close, 2006 through 2025.
The headline numbers
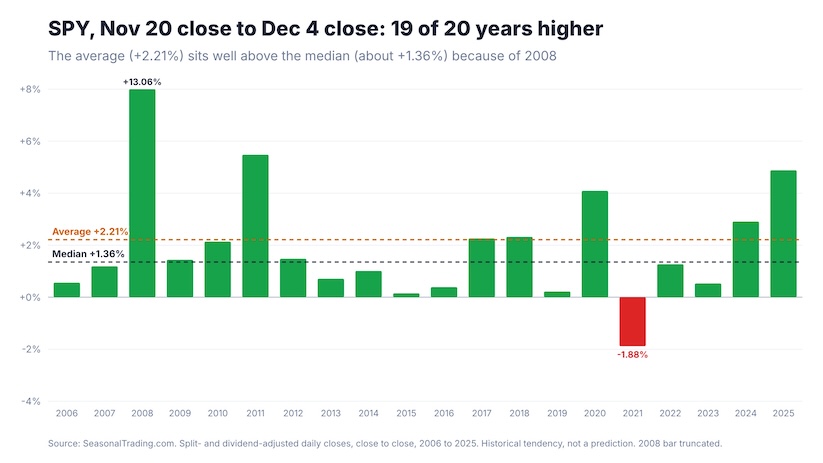
- SPY, close of Nov 20 to close of Dec 4: higher in 19 of 20 years, average gain +2.21%.
- QQQ, Nov 20 to Dec 8: higher in 19 of 20 years, average +2.85%.
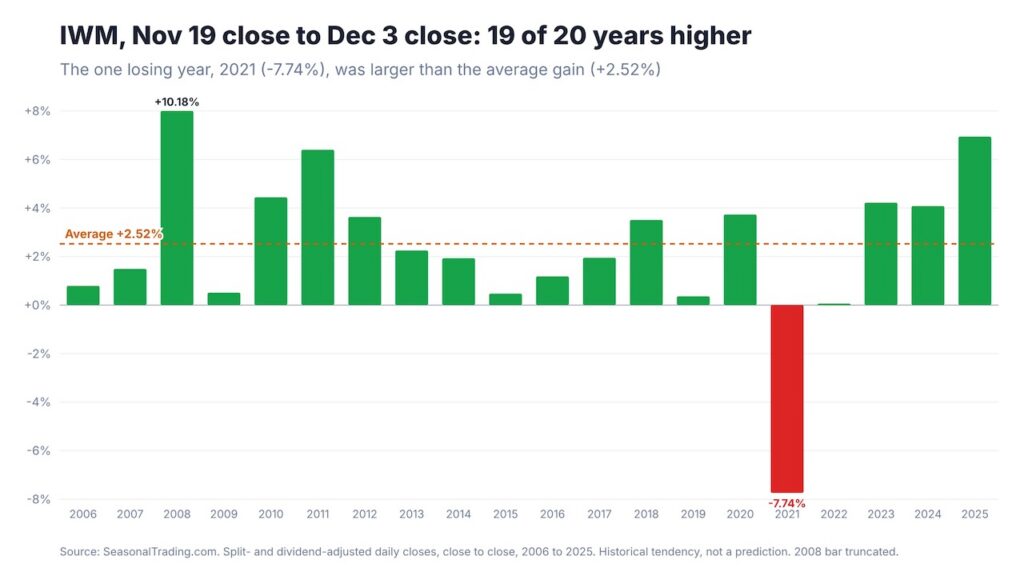
- IWM, Nov 19 to Dec 3: higher in 19 of 20 years, average +2.52%.
When a date falls on a weekend or holiday, entry and exit use the next trading day’s close.
A 19 for 20 hit rate gets attention. Before treating it as an edge, it is worth looking at how those gains are distributed.
The average is carried by one year
For SPY, the Nov 20 to Dec 4 window returned +13.06% in 2008, a bear market rebound off the November 2008 low. Remove that year and the average of the other 19 years falls to about +1.64%. The median across all 20 years is about +1.36%. Most years produced a modest gain in the 0.2% to 2.5% range, with a handful of larger moves in 2011 (+5.48%), 2020 (+4.09%) and 2025 (+4.88%).
QQQ shows the same shape. Its 2008 window gained +17.68%, while years like 2015 (+0.13%), 2016 (+0.03%) and 2021 (+0.08%) were barely positive. A win is a win in the count, but a +0.03% win does not pay for slippage.
The takeaway: the frequency is the robust part of this pattern. The size of the average is not.
The losing year tells you about the risk
For SPY and IWM, the one losing year was the same: 2021. SPY fell -1.88% over the window. IWM fell -7.74%, as small caps broke down after the Omicron variant news on Thanksgiving Friday and a hawkish shift from the Fed in the days after.
That single IWM year is larger than the average gain. A pattern that wins 19 times out of 20 can still produce a loss bigger than three typical wins, which is why position sizing matters more than the hit rate here.
Bonds tell a shorter story
TLT, the long-dated Treasury ETF, has its own version of the post-OPEX window, but it is shorter. From Nov 20 to Nov 27, TLT rose in 18 of 20 years, averaging +1.10%. Then December has historically been flat: TLT was higher in only 6 of the last 20 Decembers, with an average return of +0.01%. If you look at bonds through a seasonal lens, the tendency has been a Thanksgiving week bid, not a year-end trend.
Why these windows can look stronger than they are
Calendar windows like these are usually found by testing many start and end dates and keeping the best. With 20 samples and dozens of candidate windows, some will look excellent by chance. Three checks help:
- Is the neighborhood strong, or just one exact date pair? For SPY, nearby windows also hold up: Nov 17 to Dec 8 was higher in 18 of 20 years and Nov 19 to Dec 4 in 18 of 20.
- Do related markets agree? Here SPY, QQQ, IWM and DIA all show similar late November strength, which is more convincing than a single ticker.
- Is there a plausible reason? Commonly cited explanations include the turn of the month, holiday-week volume patterns and year-end fund flows. None of these guarantees a repeat.
How to use it
Seasonality is a historical tendency, not a forecast. It says nothing about whether 2026 will look like 2008, 2021 or a typical year. It works best as context: a reason to be a little more patient with a long position through early December, or a reason to be suspicious of a breakdown that runs against a historically firm part of the calendar.
If you use it to size trades, size for the 2021 outcome, not the 2008 one. The full day-by-day and month-by-month record for SPY is on the SPY seasonality page.
Method: 2006 to 2025, daily closes adjusted for splits and dividends, close to close. Entry is the close of the first trading day on or after the entry date; exit is the close of the first trading day on or after the exit date. Past performance does not guarantee future results.Disclosure: SeasonalTrading.com publishes seasonality data and analysis, including the SPY page linked above. This article is for information only and is not investment advice.
Twitter: @DBurgh @buildalpha
No position in any of the mentioned securities at the time of publication. Any opinions expressed herein are solely those of the author, and do not in any way represent the views or opinions of any other person or entity.