Copper and Gold miner Freeport McMoRan (FCX) is in the middle of all things metals.
And the economy.
As the economy heats up, copper prices tend to follow. And if interest rates and / or inflation ticks higher, Gold tends to follow.
Over the past 18 months, Freeport McMoRan’s stock (FCX) has risen sharply. This has come as the economy has picked up and an uptick in inflation has followed. But the stock’s price has begun to pull back and lose momentum. Will this be a sign of an overall slowdown?
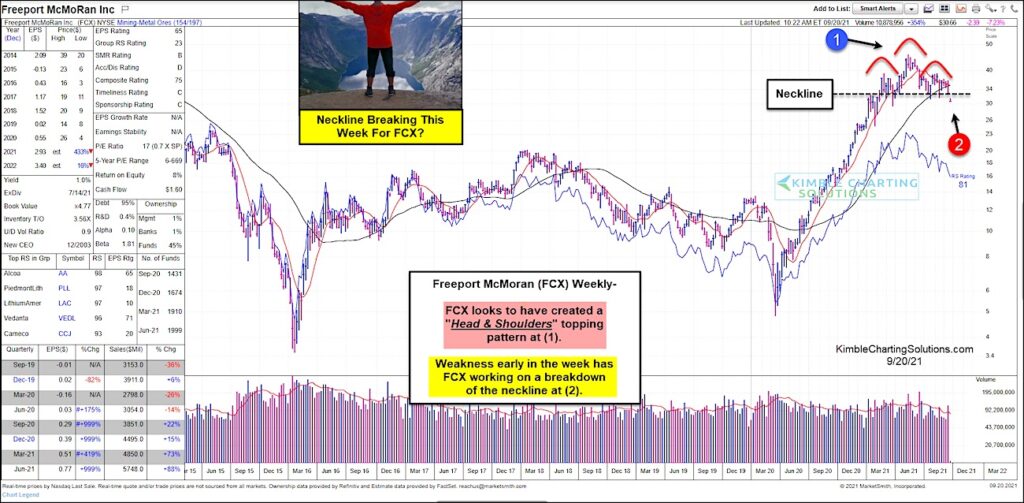
Looking at the “weekly” chart of $FCX, we can see that the stock’s slowdown has formed an ominous “head and shoulders” bearish pattern at (1). And price is now attempting to break below the neckline of this pattern at (2).
Further weakness would be bearish for $FCX bulls and perhaps the broader economy and market. Will bulls step up and save $FCX? Or will bears feast on this developing weakness? Stay tuned!
$FCX Freeport McMoRan “weekly” Stock Chart
Note that KimbleCharting is offering a 2 week Free trial to See It Market readers. Just send me an email to services@kimblechartingsolutions.com for details to get set up.
Twitter: @KimbleCharting
Any opinions expressed herein are solely those of the author, and do not in any way represent the views or opinions of any other person or entity.


