 In the wide world of inter-market analysis, one of the outstanding and widely-discussed cross-asset class relationships lies between Equities and currency pairs involving the Japanese Yen (commonly referred to as “Yen crosses”). Over the past few months, an emergent trend has developed in this relationship that raises the question: does the under-performance of these currency pairs foretell a stock selloff?
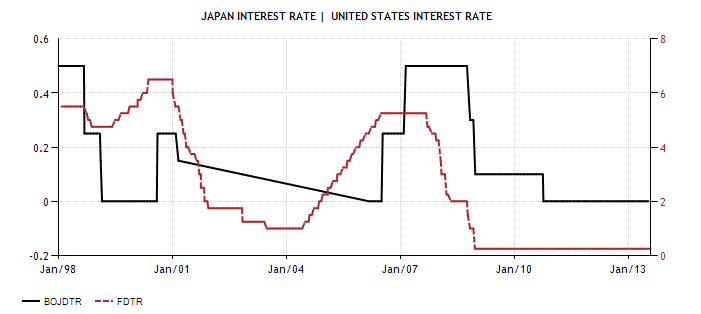
Though the primary historic impetus for the relationship between equities and JPY crosses (e.g. USD/JPY, EUR/JPY, GBP/JPY) was irrevocably and abruptly reduced in the acute risk-off environment of latter 2008 with the unceremonious unraveling of the Yen carry trade, a tight positive correlation between stocks and this subset of currency pairs lives on. With a BoJ-set overnight benchmark lending rate of 0%, for those with the inclination and the means the Japanese Yen remains a ridiculously cheap funding option – if one with the implicit cost of considerable currency risk.
Japan: Funding Risk on the Cheap – 1998-2013 (US axis right): (click image to zoom)
In this context, commodity JPY crosses – AUD, NZD, CAD – have adhered especially closely to US stocks; and none better than AUD/JPY.
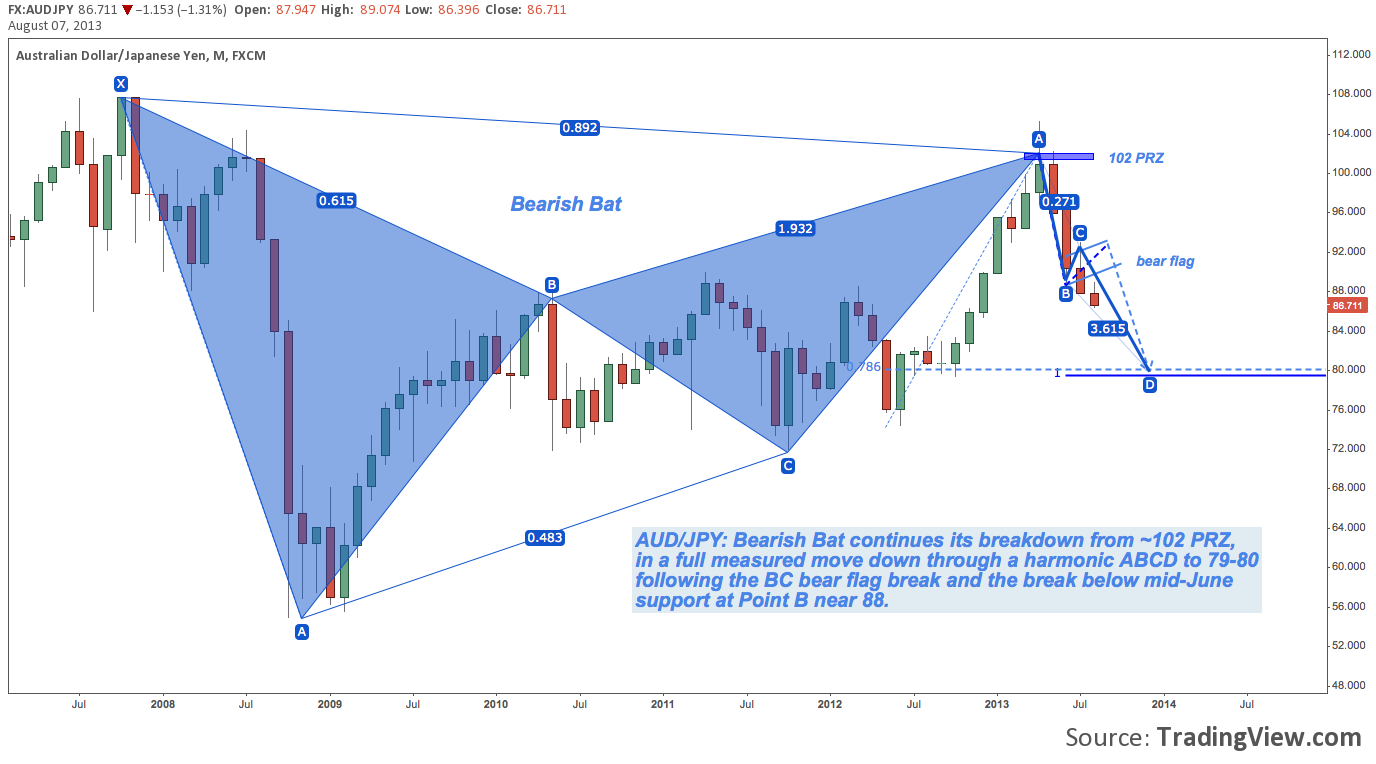
Aussie/Yen (AUD/JPY) – Monthly
From its late 2007 high near 108 through the 105.25 April 2013 high, AUD/JPY has traced a bearish Bat harmonic pattern. As the chart below illustrates, after an intra-month bull trap in April, this pattern rolled over at its potential reversal zone (PRZ, denoted by purple rectangle) near 102. Nearly 4 months later, the pair was last seen sporting a noticeable limp some 1500 pips lower near 86.70 in staggered pursuit of a harmonic ABCD targeting 79-80: (click image to zoom)
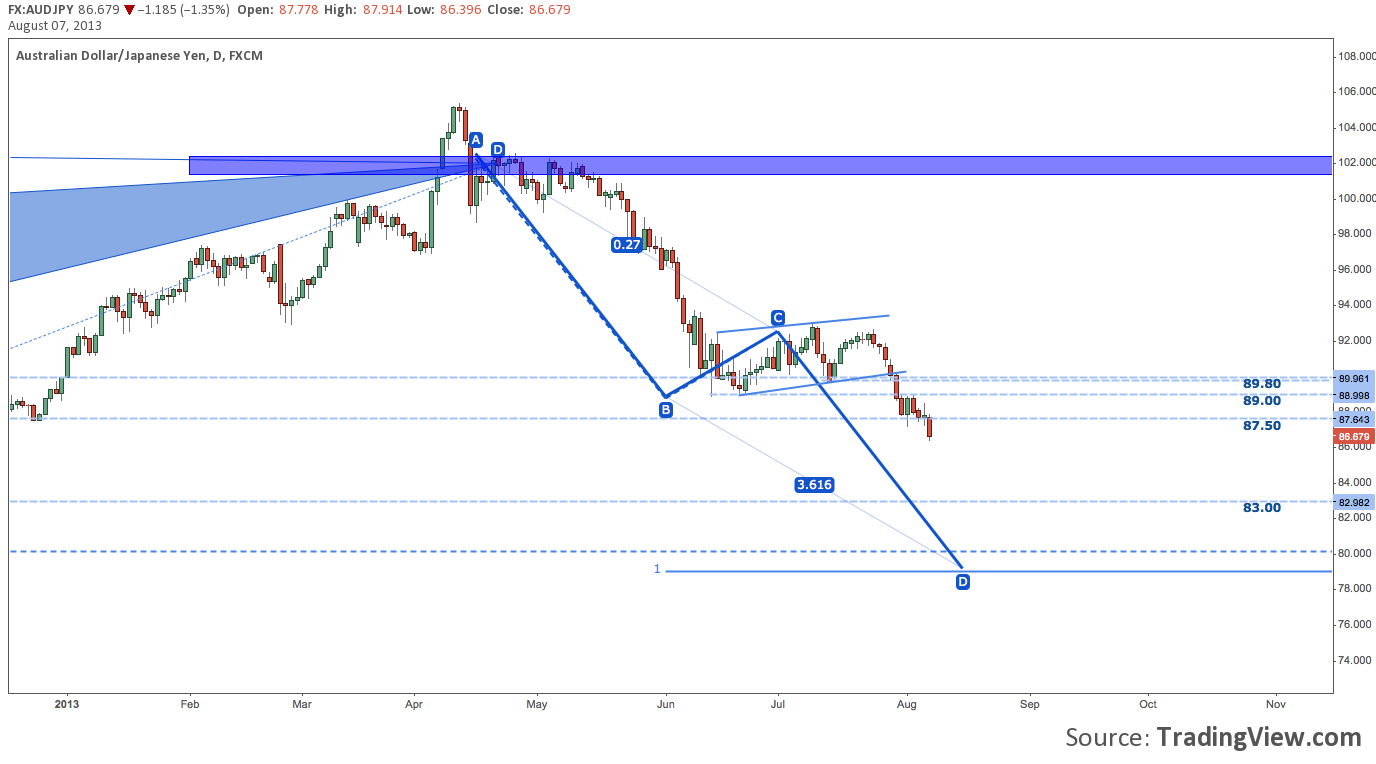
Aussie/Yen (AUD/JPY) – Daily Harmonic ABCD Zoom
Here’s the ABCD and bear flag in greater detail. (click image to zoom)
All told, the Aussie/Yen has shed -17.4% since it’s intra-month April 2013 high. That kind of change isn’t unheard of JPY crosses, which as a functional rule exhibit more volatility than Major pairs such as EUR/USD, GBP/USD and USD/CHF. Nevertheless, a nominal move well into the double digits like this in a small handful of months triggers some well-justified interest. The macro fundamental calculus between Australia and Japan that provides backdrop for this move is complex and fascinating; but in point-of-fact this move into the Yen is well-correlated across the entire JPY cross complex – much to the chagrin of Japan’s Ministry of Finance, the Bank of Japan and their weapons of mass debasement.
In this context, the aforementioned tight positive correlation between AUD/JPY and equities – US equities, in this instance – intuitively means a significant stock selloff has been underway since April. Indeed…
Aussie/Yen (AUD/JPY) vis-a-vis S&P 500 (ES) Correlation – Weekly:
…it turns out this is not the case. (click image to zoom)

As you’ll note in the top panel AUD/JPY and S&P 500 E-Mini Futures (Symbol: ES, green line) move in near lockstep with each other most of the time. The bottom panel evokes this relationship between the instruments by tracking their correlation coefficient. Points where the correlation breaks down and even switches negative are highlighted; but they remain few and are usually mostly remedied/closed within 10 periods of opening (denoted by vertical blue lines).
The current divergence is of greater magnitude to the one that bisects and disrupts 10 years of a relatively placid positive correlation: mid-2008. The difference there occurred when AUD/JPY continued to rally through July 2008, even after the S&P began to sell off anew that May. One can speculate about the origin of this disjunction: given the context it may have been 11th-hour carry adoption into the S&P’s post-Bear Stearns mid-March to Mid-May relief rally from 1253-1430. But whatever the case, AUD/JPY’s advance peaked mid-July and then rapidly caught down through later July and August as ES patiently lulled in a narrow 1250-1300 window.
Today’s divergence puts the S&P’s performance on top: an atypical arrangement that began in October 2011, completely closed between November 2011 and mid-April 2013 through aggressive Abenomics-era JPY abasement; and finally reopened mid-April 2013 to through the present with the S&P’s 32% out-performance of AUD/JPY.
The performance disparity evident in this tightly-tracking intermarket relationship is suggesting one of three probable outcomes:
- AUD/JPY Meltup: Given that the BoJ’s nuclear QE arsenal was largely spent in April when Kuroda proudly unfurled its plan double the Japanese money supply by YE 2014 via an “unprecedented level of QE”, and that the RBA is still on the road to its lower bound with this week’s 25bps cut to 2.5% and RBA Governor Stevens’ incredibly dovish policy outlook, this outcome is possible, but doubtful.
- Range Hell: the yawning AUD/JPY and S&P 500 disjunction will saunter sideways as both central banks attempt to out-coo one another in a nightmarish monetary policy parody satire of The Birds. Since any negative correlation resembling this in the past has snapped back – reflexively sending the correlation streaking higher toward at least 0.5, and usually into the 0.8-1.0 positive quintile – this outcome is unlikely in anything beyond the very short-term (i.e. one month).
- S&P 500 Catch-Down: the more probable scenario is that the S&P 500 (ES here) will catch down in a stock selloff. This may be accompanied by AUD/JPY relative outperformance as the pair moves sideways on an absolute basis waiting for the stock index to return to alignment. Precedent for this type of outcome is visible among other examples with stocks waiting on AUD/JPY in Summer 2008 and Fall 2012; and AUD/JPY taking its turn waiting on equities in Summer 2003 and 2004.
What about other JPY crosses?
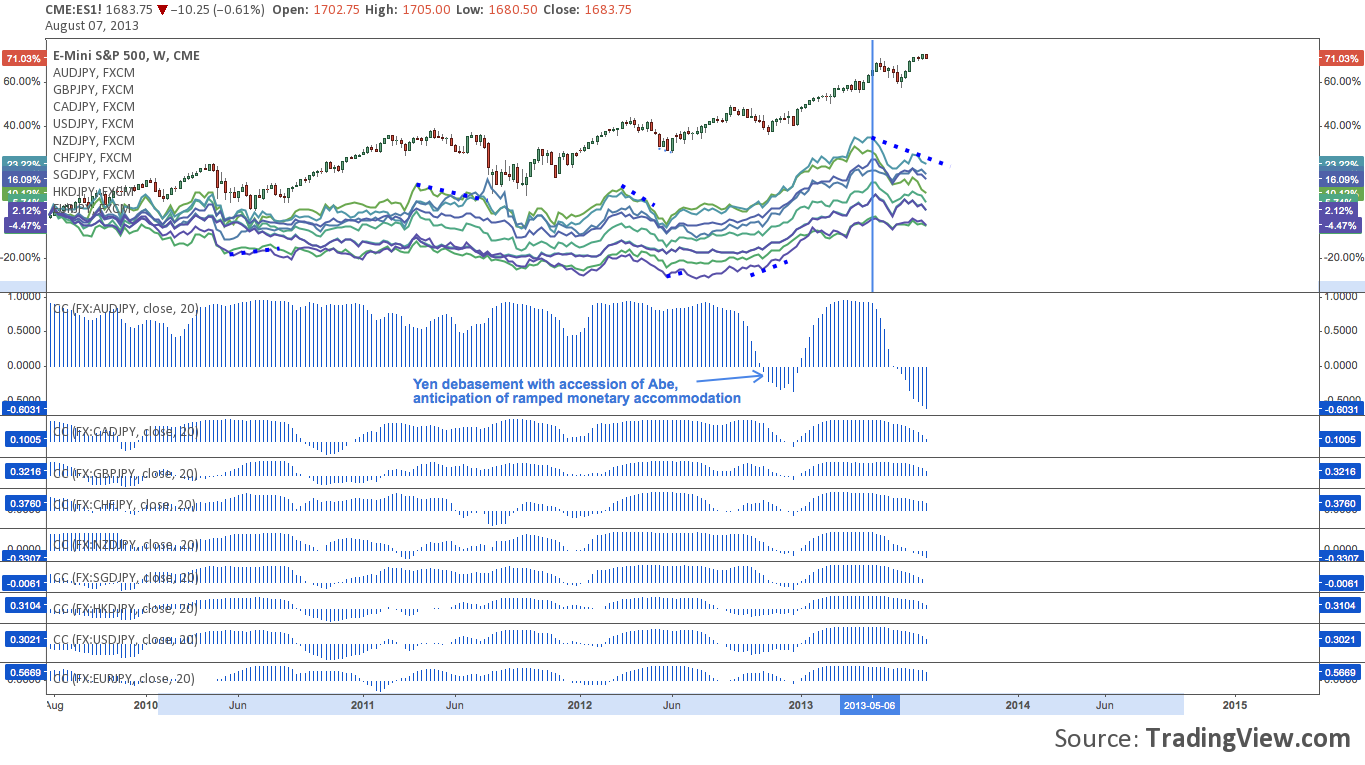
S&P 500 (ES) vis-a-vis JPY Cross Complex Correlation – Weekly:
The summary representation of the most commonly traded JPY crosses (with a few that are less so, such as HKDJPY) displays the diffusion between these individual pairs while demonstrating they are very tightly correlated. Much of this is attributable to “carry”-derivative strategies as alluded to earlier; and the related the ebb and flow of the global-macro RoRo (Risk-on-Risk-off) environment to which JPY has been especially vulnerable as a funding currency. (click image to zoom)
Though it’s an imprecise look, the JPY cross complex has shown some remarkable unanimity in presaging major turns (purple dotted lines) in the S&P 500. These divergences are rarely ever easily-traded, even where they do precede stock selloffs (no surprise given the time frame under and the diverse macro representation involved).
But consider: as a proxy for risk flows, the best-correlated JPY crosses such as AUD/JPY and the aggregate testimony of the complex can and do give early warning when ZIRP-funded risk appetite is being tamped down; or spun up. Since early May (and the FOMC meeting April-30-May 1 which initially sparked talk about the taper), the S&P has established nominal new all-time highs, while the complex has generated its clearest divergence (along with the Nikkei’s lower high) in years.
Twitter: @andrewunknown and @seeitmarket
No position in any of the mentioned securities at the time of publication.
Any opinions expressed herein are solely those of the author, and do not in any way represent the views or opinions of any other person or entity.
: Worrisome to Broader Market?")

: Important Breakout Retest")
