One of the biggest things happening in the market right now is the move seen in financial stocks relative to the broader market (i.e. S&P 500).
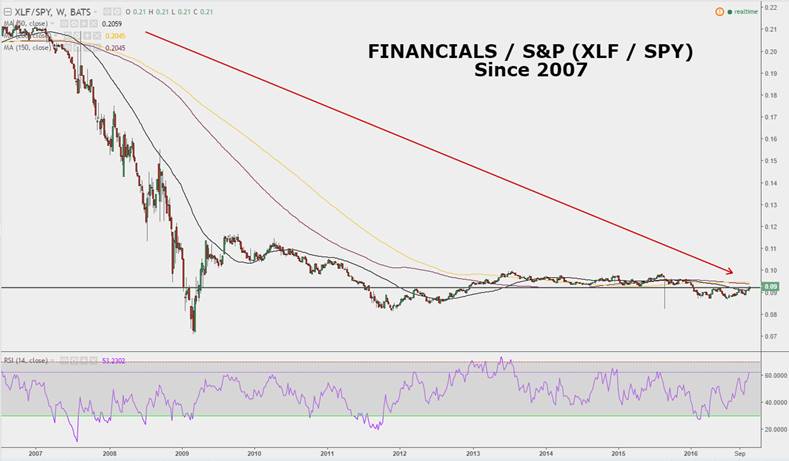
But to really appreciate the move, we need to step back and look at just how bad it’s been for financial sector stocks.
Since late October of 2007, the financial sector (NYSEARCA:XLF) alone is down -15.29%. This compares to the S&P 500 (NYSEARCA:SPY) rising 99.36%. The chart below clearly highlights this relationship.
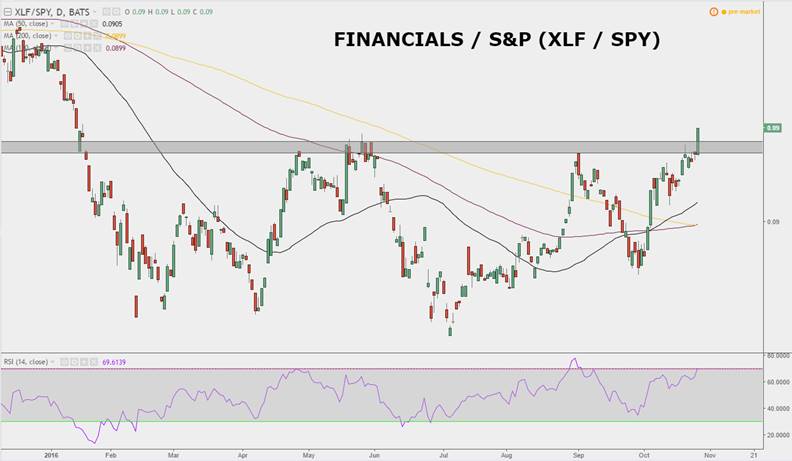
However, recently investors are seeing some signs of life for the financial sector (XLY). Zooming into a year to date chart of the XLF to SPY relationship, it is evident that this may be the breakout everyone one has been waiting on.
This is important for multiple reasons. Financials is 13% of the S&P 500 and banks are often the growth mechanism for the broader economy.
Now how sustainable is this move? I think it is pretty sustainable to be honest and it is because of the chart below. This is the 10 year yield all by itself. It now sits at 1.84%, the highest since June. The chart looks very similar to the financial charts above because as rates rise the natural perception of investors is that banks will benefit too.
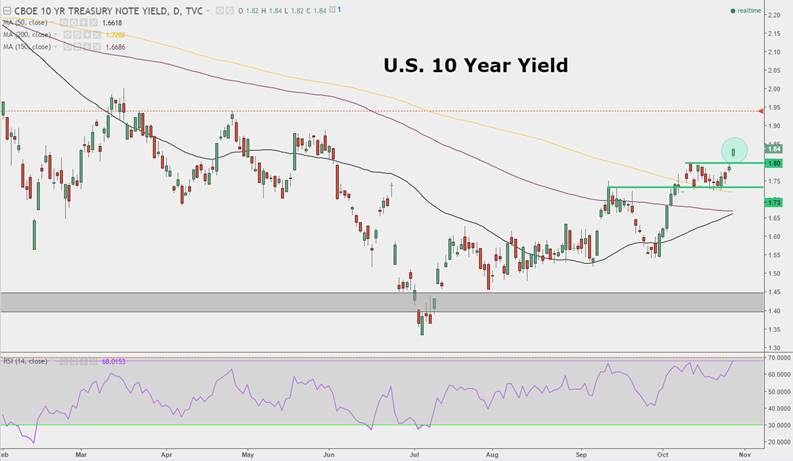
So as long as the 10 year yield stays above the latest highs, I think betting on financials relative to the S&P 500 is not a bad idea! Thanks for reading.
You can catch more of my market insights on my site, The Market Meter. Thanks for reading.
Twitter: @_SeanDavid
Any opinions expressed herein are solely those of the author, and do not in any way represent the views or opinions of any other person or entity.


 Flirting With Critical Support… Again")