Every day, we hear about inflation and the potential for a recession. Don’t get me wrong, they are both either here (inflation) or very real threats (recession).
At the same time, we have already met the thresholds for a bear market on the Nasdaq and S&P 500. But we don’t know if it’s over… or just beginning… or somewhere in between. If it’s over, then we should see cyclicals show some additional life. But if it’s not over, then more paid will show up.
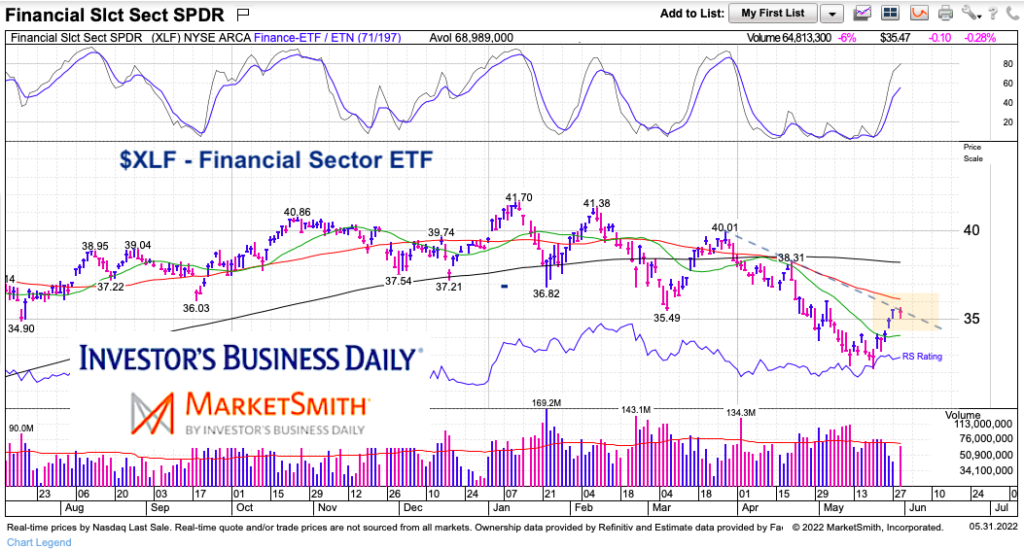
It is with this in mind that I think about banks and financials stocks. The Financial Sector ETF (XLF) has bounced off recent lows but isn’t out of danger. If the financials turn lower once again it may mean the economy is going down with them.
Today, we look at XLF and discuss why it is trading at an important time/price juncture. We also point to some simple guideposts to watch.
Note that the following MarketSmith charts are built with Investors Business Daily’s product suite.
I am an Investors Business Daily (IBD) partner and promote the use of their products. The entire platform offers a good mix of analysts, education, and technical and fundamental data.
$XLF Financial Sector ETF Stock Chart
The financials (XLF) are testing a near-term downtrend line. More importantly, XLF is closing in on the falling 50-day moving average. This intersection marks strong resistance and bulls will need to see price definitely break out above the 50-day MA. A move higher would then target the 200-day MA.
Failure here simply puts the recent lows on the radar as critical support.
Twitter: @andrewnyquist
The author may have a position in mentioned securities at the time of publication. Any opinions expressed herein are solely those of the author, and do not in any way represent the views or opinions of any other person or entity.


