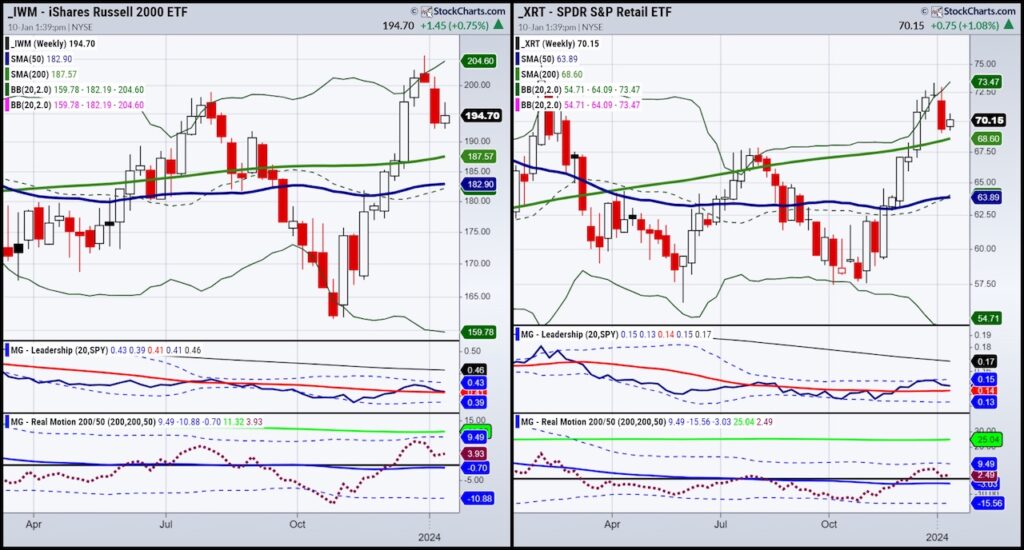
Looking at the Economic Modern Family (weekly charts), to date, they all peaked in December.
The Russell 2000, Regional Banks, Transportation and Retail, as far as index and sectors go, backed off the most from their peaks.
Semiconductors are more sideways since the peak as well as Biotech (which remains the strongest sector right now).
This sets the stage for a January calendar reset- a range that is effective for the entire year (even though we get a new range in July) and will show itself next week.
For example, with IWM January high at 201.62 that will most likely be the 6-month January calendar range high.
The low thus far is 192.26, so unless that is violated, could be the January calendar range low. That range is crucial to watch. Above, one must be bullish. Below, one must be cautious. And in between, one must warrant patience as the market could chop.
We use small caps as a gauge for the overall economic sentiment. Although growth stocks shine, we believe without small caps, the growth stocks should sell off as well. Retail is of particular interest as some of my stock picks (my vanity trade) are doing well while the ETF itself sits above key support that must hold.
The growth space is getting crowded again, while the “inside sectors” show some wear and tear. We have been here before.
While Newton’s law states that things in motion stay in motion, we believe remaining agnostic overall on next major direction until these calendar ranges reveal themselves is wise.
What about Commodities?
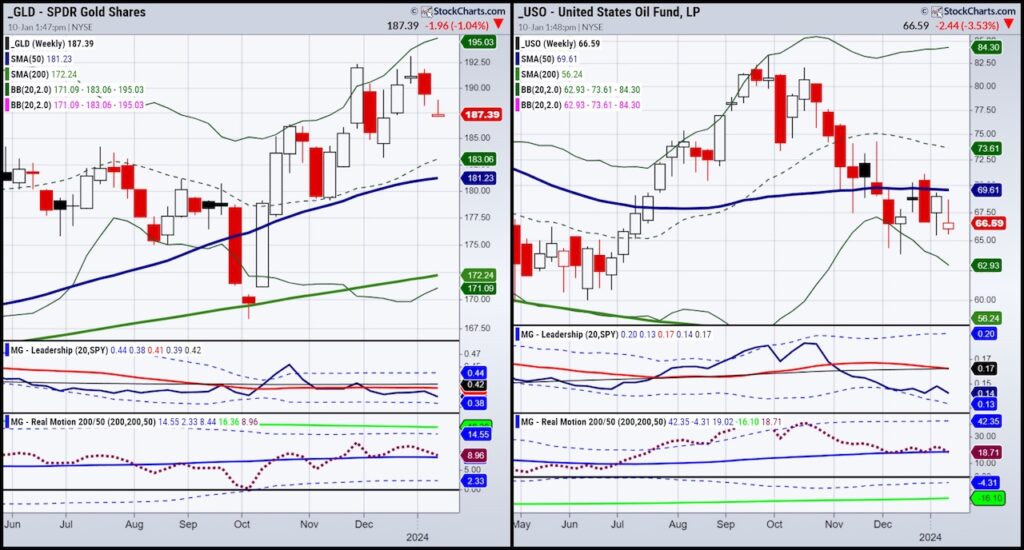
The CPI number will be watched carefully. However, we are more interested in supply chain, geopolitics, the FED on rates and the dollar trajectory. The dollar looks more vulnerable in the longer term, even with the recent pop.
Gold still looks poised even though it is more range bound now (another great 6-month calendar ranger to watch). And oil, also rangebound, is starting to consolidate between $70-73 a barrel. We remain of the opinion that commodities can take as long as late spring to early summer to pick back up.
On the weekly charts, both GLD and USO are underperforming the SPY, which is risk on.
Momentum is in a bearish divergence in gold, which means that is possible to see lower prices, although we believe $2000 should hold.
In oil, momentum is in a bullish divergence, which implies that this selling right now could be waning leaving room for an up move. Check out some of the amazing picks and how they have performed!
Twitter: @marketminute
The author may have a position in mentioned securities at the time of publication. Any opinions expressed herein are solely those of the author and do not represent the views or opinions of any other person or entity.


