Failed breakouts can be extremely powerful patterns, especially when combined with momentum divergences across multiple time frames. Experience has shown us that from failed moves come fast moves in the opposite direction, which is why I’m watching Global Payments Inc. (GPN).
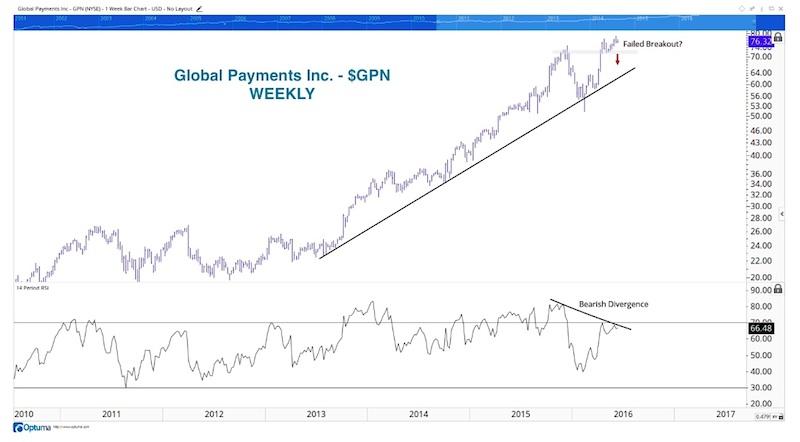
Global Payments Inc. ($GPN) Weekly Chart:
GPN is sitting just off all-time highs, but what’s important from a structural perspective is the potential failed breakout that’s developing above the highs from late last year. Momentum is failing to confirm these new highs and if prices close back below 72.50, that would confirm this bearish divergence and failed breakout. This development would likely lead to a test of the uptrend line from the July 2013 lows near 63.
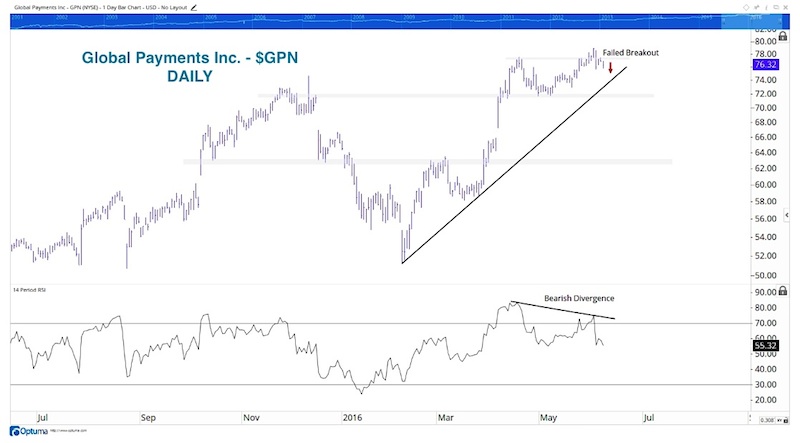
Global Payments Inc. ($GPN) Daily Chart:
Tactically, GPN has already confirmed a failed breakout above the April highs and the bearish momentum divergence that’s been building over the past six weeks. As long as prices are below the April highs of 77.55 on a closing basis, the bias remains to the downside. If prices break the uptrend line from the February lows, as well as the May lows, this would confirm the structural failed breakout discussed above and likely accelerate the selling. If this occurs, the next major support level sits at roughly 63, which also corresponds with the uptrend line discussed on the weekly chart above.
The Bottom Line: As long as prices remain below the April highs of 77.55 on a daily closing basis, a neutral / bearish bias is appropriate in Global Payments Inc stock. The failed breakout and bearish momentum divergence have already confirmed on the daily chart, while they will confirm from a structural perspective with a weekly close below 72.50. The risk is very well-defined, and the risk/reward is elevated given the ultimate price target of 63 discussed above. With that being said, it’s important to understand what your timeframe and individual trading plan is, as that will have implications for how you approach this setup.
Thanks for reading. As always, if you have any questions feel free to reach out and I’ll get back to you as soon as I can.
Read more on Tom’s blog, Bruni Charting.
Twitter: @BruniCharting
The author does not have a position in any of mentioned securities at the time of publication. Any opinions expressed herein are solely those of the author, and do not in any way represent the views or opinions of any other person or entity.

: Showing Some Signs of Emerging Strength")
