One of the most common behavioral biases, confirmation bias is when you determine your conclusion and then gather evidence to back it up. Mindful investors gather evidence first and then make decisions based on the weight of that evidence.
Technical analysis can tell you a great deal about the collective psychology of investors, but to get a pure read on supply and demand you need to focus solely on price behavior to ensure you don’t cloud your judgment!
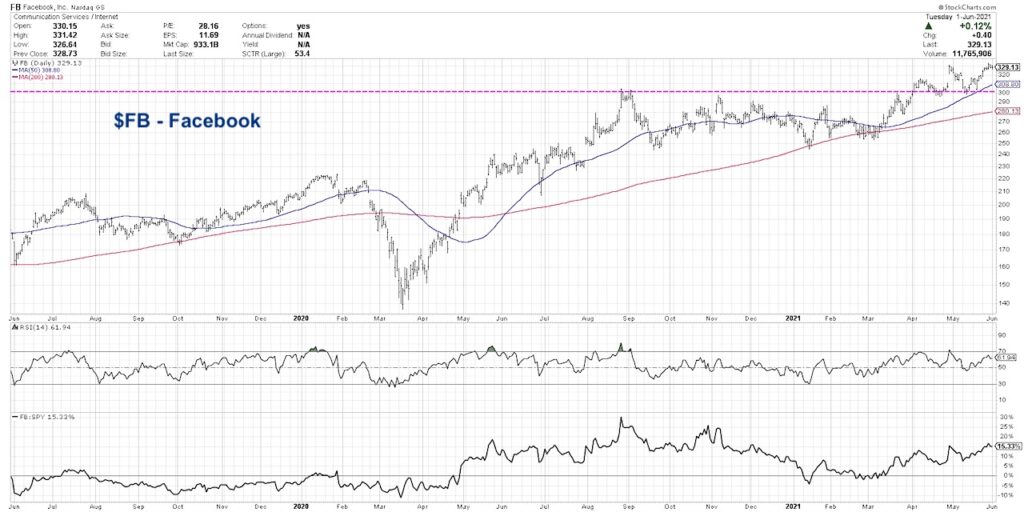
In today’s video, we’ll define confirmation bias, explain how it creeps into your investment process, and review strategies to minimize its impact in your decisions. Along the way, we’ll break down the chart of Facebook (FB) using a technical checklist and explain why the path of least resistance appears higher. Here are a few discussion points in today’s video. See chart further below for reference.
– What is confirmation bias, and how does it affect your ability to gain a clear picture of investor sentiment?
– How do seasoned technical analysts disconnect the company from the stock in their thinking, allowing them to identify entry and exit points without being biased with fundamental thinking or news flow?
– What “line in the sand” would suggest a more risk-off scenario for this key benchmark name?
For deeper dives into market awareness, investor psychology and routines, check out my YouTube channel!
One Chart: Facebook Stock (FB) – Confirmation Bias
$FB Facebook Chart
Twitter: @DKellerCMT
The author may have positions in mentioned securities at the time of publication. Any opinions expressed herein are solely those of the author, and do not in any way represent the views or opinions of any other person or entity.

 Testing Important Price Support")
: Cup (and Maybe Handle) Watch")

