The Euro has been hit hard and negative sentiment is reaching an extreme. A couple weeks ago we posted how PRICE = TIME and the Euro hit the target exactly.
That being said, the FORM and PROPORTION just didn’t look correct from the perspective of “is this a tradable bottom.” So, from 1.2500 we rallied in 3 waves and, after that, the picture became clear that we needed “one more wave” down to look for a stronger bounce.
At this time, sentiment and price patterning appear to be calling a tradable bottom in the Euro.
I know NOTHING about the ECB and the fundamentals rocking the Euro-zone right now. But, I do know PATTERNS. The PATTERNS suggest we have bottomed (for now) and a good 400, 600, or even 800 pip rally is not out of the question. Mind you, if you look at the charts below, you’ll find we have just completed the first 5 wave sequence down. In the “pure play Elliott Wave world” this means a B wave is coming… a FLAT (or expanded), a ZIG-ZAG, or a TRIANGLE will present itself. I DO NOT know which form it will take.
Here’s one thing that you can take to the negative interest rate bank (that was a joke) – the next wave of selling ”should” be “a wonder to behold” – “generate the greatest volume and price movement” (EWT page 78 if a 3rd) or “devastating in their destruction” with “virtually no place to hide” (EWT page 81 if a C).
With that said, let’s look at the charts.
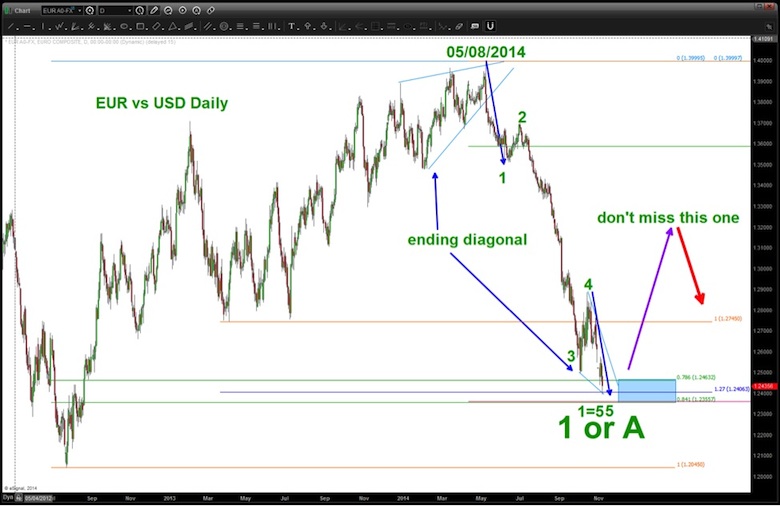
EUR vs USD Daily:
- Note – 1,2,3,4,5 w/ 5 equal to 1 exactly at todays (11/6/2014) low
- Also note, we did an ending diagonal to begin this move and now, an ending diagonal to end it. Tops and bottoms like to show the same form …
- Labeling a 1 (5 waves complete down) or A (5 waves complete down) so 2 or B to follow
- THIS ANALYSIS IS WRONG BELOW 1.2360 ish.
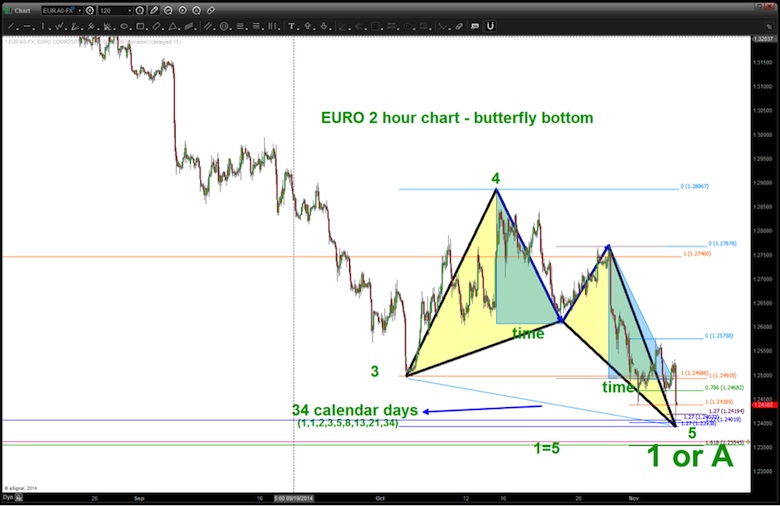
EURO vs USD 2 hour chart:
- Yellow Shaded Triangles form a butterfly bottom.
- TIME: the last leg of the butterfly (blue shaded triangles) are EXACT.
- TIME: the entire butterfly pattern took 34 calendar days to form
- 1,1,2,3,5,8,13,21,34 …
- PRICE: the last leg of the butterfly has the ratio 1.27ab=cd.
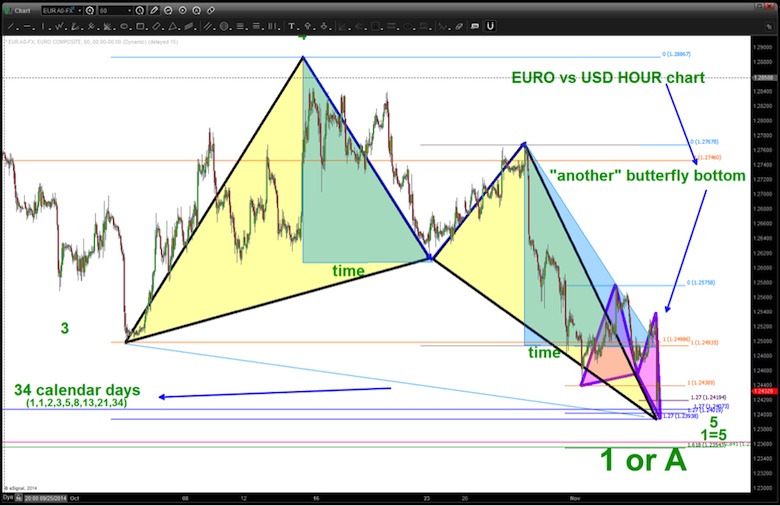
EURO vs USD Hourly Chart:
- Butterfly pattern (purple triangle) complete.
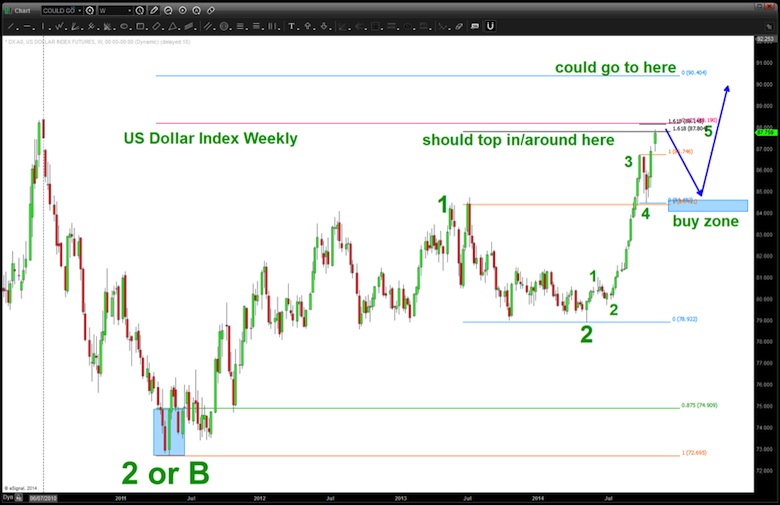
And finally, here’s a “quick look” at the U.S. Dollar Index. As annotated on the chart, it “should” top in/around here for a move back to the “previous” wave 4 of a lesser degree and then start going again.
Follow Bart on Twitter: @BartsCharts
No position in any of the mentioned securities at the time of publication. Any opinions expressed herein are solely those of the author, and do not in any way represent the views or opinions of any other person or entity.

 Testing Important Price Support")
: Cup (and Maybe Handle) Watch")

