Energy stocks have remained strong as crude oil prices remain elevated.
But the Energy Sector ETF (XLE) has traded sideways this year and finds itself trading into a common support/resistance area: the longer-dated 200-day moving average and 40-week moving average.
Today’s charts are more of an educational display of why moving averages matter. And perhaps they matter more to different sectors / assets. Either way, today we focus on why current trading could be important and how these longer-dated moving averages have served as trend support, and a few times as trend breakdowns.
Note that the following MarketSmith charts are built with Investors Business Daily’s product suite.
I am an Investors Business Daily (IBD) partner and promote the use of their products. The entire platform offers a good mix of tools, education, and technical and fundamental data.
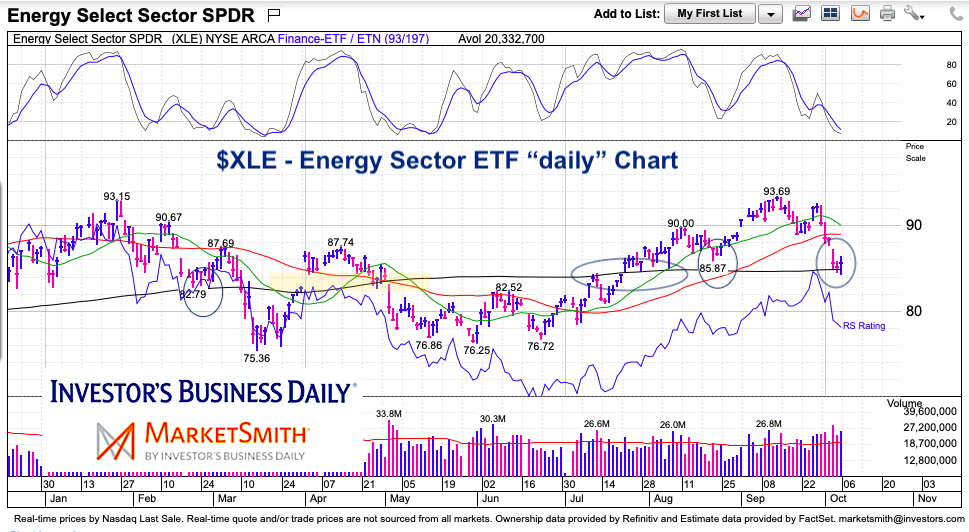
$XLE Energy Sector ETF “daily” Chart (200-day moving average)
Here we can see that XLE is testing its 200-day moving average. See prior few times (circled). My concern here is that the 20-day is turning down and the 50-day is flattening. This means a reversal would need to be sharp to overcome the loss in momentum. Keep an eye on this.
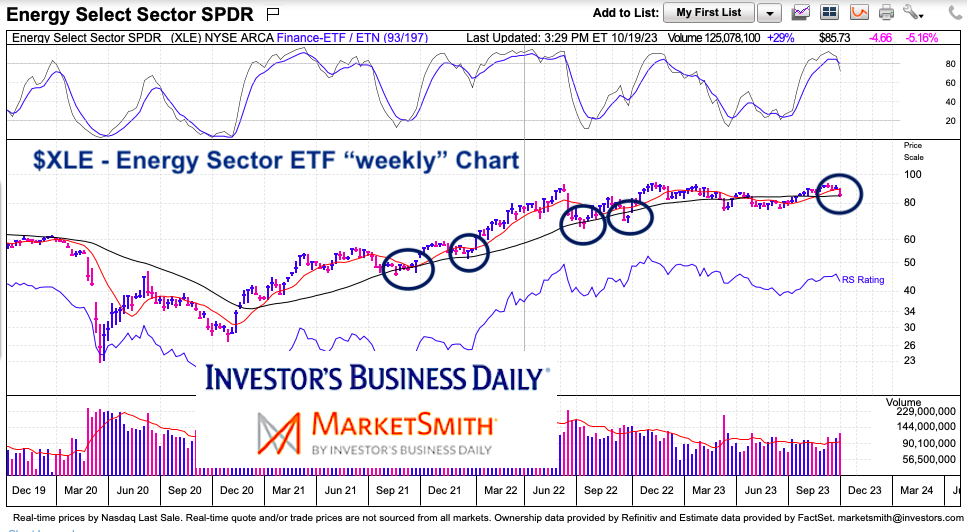
$XLE Energy Sector ETF “weekly” Chart (40-week moving average)
Here the Energy Sector (XLE) is testing the 40-week moving average. We can see that this area has been a major support during the bull run. So if bulls are gonna step up, it should be now.
Twitter: @andrewnyquist
The author may have a position in mentioned securities at the time of publication. Any opinions expressed herein are solely those of the author, and do not in any way represent the views or opinions of any other person or entity.

: Showing Some Signs of Emerging Strength")
