Who knows what OPEC will actually do. And really, who even cares? At least, that’s the trader in me.
OPEC “noise” is just something that adds short term movement to crude oil prices and drives sentiment shifts in oil prices and energy stocks. Is it time to tune out the noise and fade energy stocks and the OPEC meeting?
Perhaps.
If you want real information on the energy market, take a look at some of the energy stock ETFs.
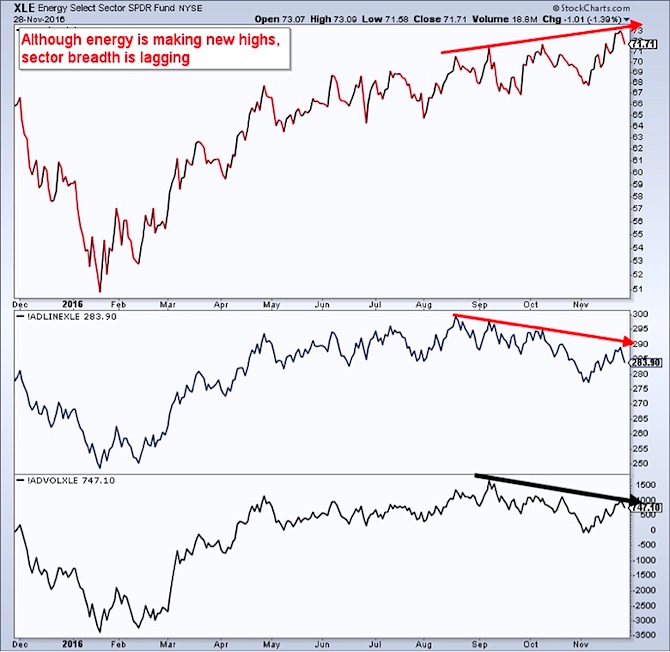
Here’s a look at the Energy Sector ETF (NYSEARCA:XLE) with a sector breadth overlay. For months now the the advance-decline line and up-down volume have significantly dropped off and diverged from price. Any index rise on less and less breadth is bound to be unsustainable. That said, this can easily continue until XLE makes a lower low.
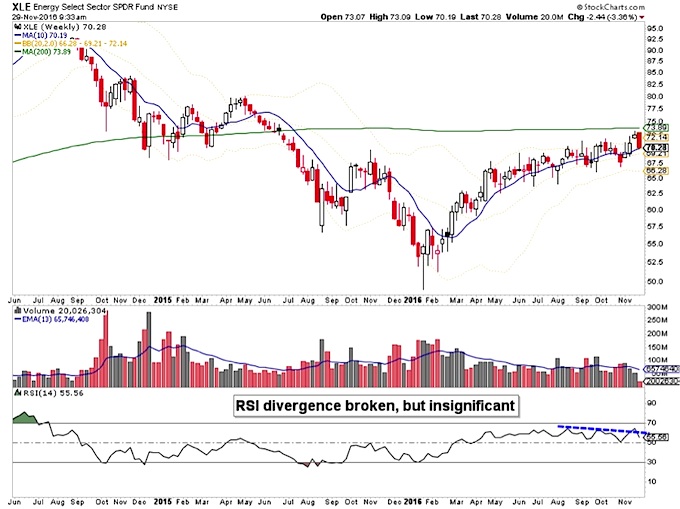
Let’s take another look at XLE, this time a weekly longer term view.
Price has reached the flat 200 week moving average for the first time in 18 months. Note that last week the group busted a momentum divergence. Early in trade this week, RSI has fallen back below the trendline. We’’ll know if this is a false trendline break at the end of the week. Needless to say this week’s close will be important.
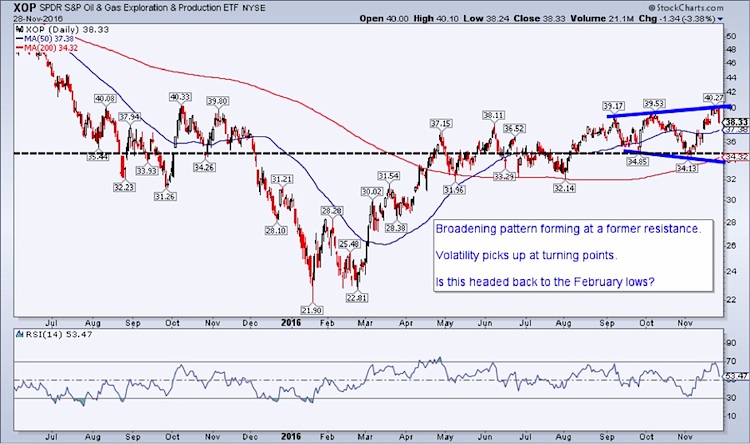
Here’s a look at the Oil & Gas Exploration ETF (NYSEARCA:XOP). It’s trading at the top of a 16 month range. This is also trading in a broadening pattern. Typically we see broadening patterns and increased volatility at turning points. Is it possible we’re just at the top end of the range? I think so although a higher low and higher high would change that.
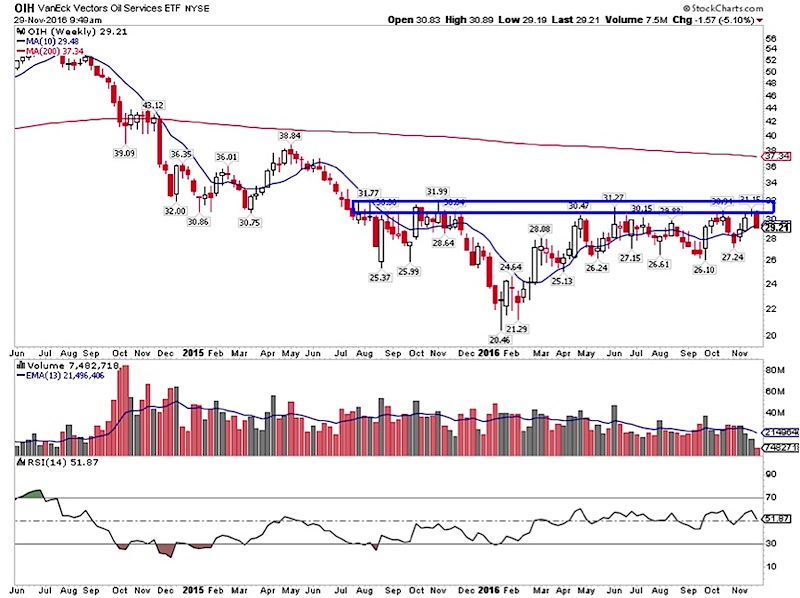
Finally, here is Oil Services ETF (NYSEARCA:OIH). It’s been stuck at this resistance level for months now at the top of this range. There are no signs it wants to break higher, although typically box ranges are bullish. If OIH breaks and holds above 32, this turns into a huge positive quickly.
I think the charts are pretty clear cut – and they’re telling me that it’s dangerous to own energy stocks right now.
I’ll leave you with a disclosure: I’m long Short Energy ETF (ERY). It’s possible my views are biased and all investors are best served making their own judgements about the evidence presented.
Trade ‘em well!
Twitter: @ATMcharts
Any opinions expressed herein are solely those of the author, and do not in any way represent the views or opinions of any other person or entity.

: Showing Some Signs of Emerging Strength")
