Crude oil in the $60s looks like a gift. War abroad, OPEC talking tough, summer driving season approaching.
Oil prices are turning higher and, IF this marks a tradable bottom, it could mean big things for the Energy Sector ETF (XLE).
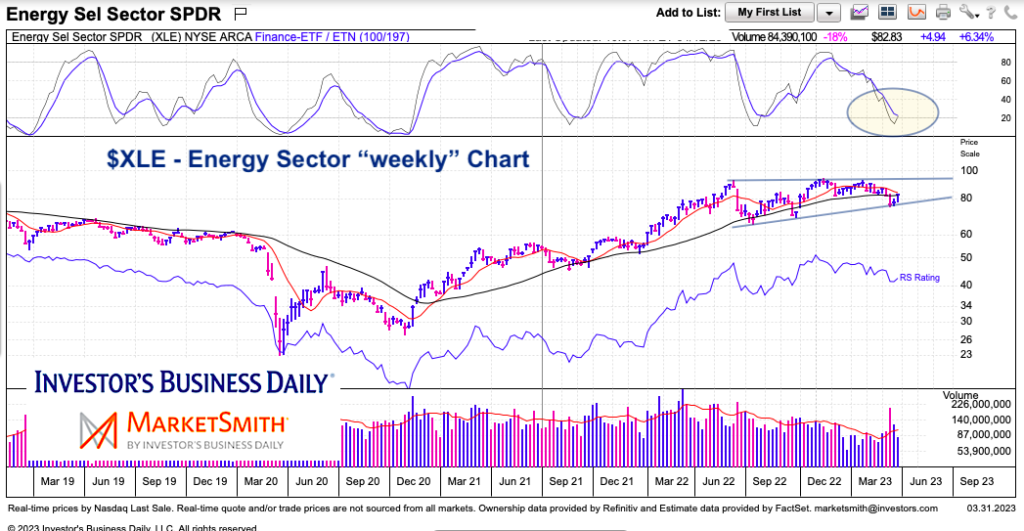
Bear in mind, XLE started to reverse course a couple weeks ago (front-running?)… and now it looks poised to retest the $90-$95 resistance level.
Note that the following MarketSmith charts are built with Investors Business Daily’s product suite.
I am an Investors Business Daily (IBD) partner and promote the use of their products. The entire platform offers a good mix of tools, education, and technical and fundamental data.
$XLE Energy Sector “weekly” Chart
Momentum is turning higher as price looks to reverse off trend support. This reaction could rally up over the $90 level. BUT, the strength of the rally will be tested at resistance ($93-$95 recent highs). That level will determine if this rally is actually the start of something bigger.

Twitter: @andrewnyquist
The author may have a position in mentioned securities at the time of publication. Any opinions expressed herein are solely those of the author, and do not in any way represent the views or opinions of any other person or entity.


