$EEM – Emerging Markets ETF price chart analysis
I’ve heard and seen chatter about emerging markets stocks and how they can start to outperform the US stock market as we head into the new year – 2020.
This is not new chatter, as a year ago I heard the exact same thing.
We all know how that worked out. The U.S. stock markets ruled once again.
In March 2019, LetkoBrosseau wrote a paper on the Macro Economics in Emerging Markets.
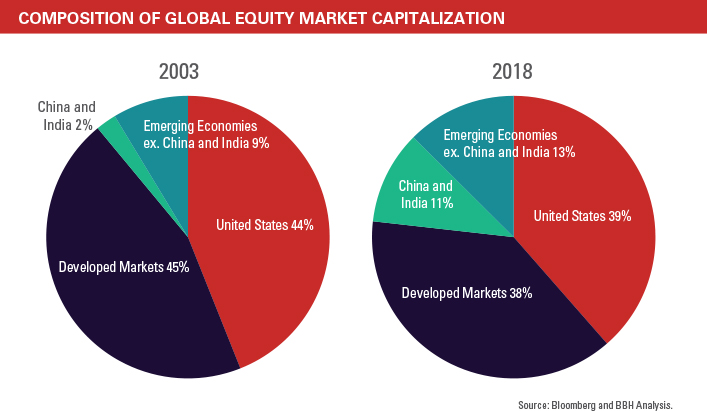
“Emerging markets have taken a key role on the world economic stage. Propelled by favourable demographics and rising incomes, these economies are growing at a pace twice that of their developed counterparts.
They now represent well over one-half of world GDP and generate more than three-quarters of global economic growth.
Yet, on a nominal basis, emerging markets represent less than one-third the value of total world stock market capitalization.”
The macro picture for 2020 might be finally catching up to LetkoBrosseau’s thesis.
Here Are Seven Points to Consider:
Fundmentals look promising, but they mean little without a technical picture or compass that helps one define entries, risk and targets.
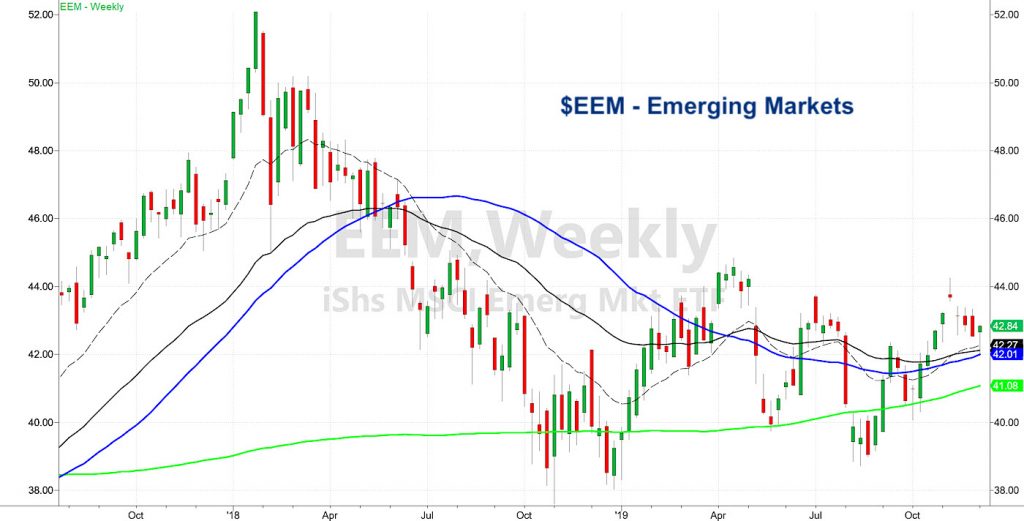
Looking at the weekly chart of the the Emerging Markets ETF (EEM), the price is above all the significant moving averages.
The slopes on all of the MAs are positive.
The price of EEM hs remained in a fairly large trading range looking at the April 2019 highs and the October 2018 lows.
This is the range bulls want to see break. A price above 45-46.00 in EEM is compelling.
Where might price head thereafter?
In early 2018 EEM traded up to 52.00.
While the US market, particularly the S&P 500 and NASDAQ have made new all-time highs recently in 2019, one can see the disconnect of the underperformance in emerging markets.
Therefore, as we head into the new year, we might finally see the perfect union between the fundamental and technical picture for why EEMs can play some serious catchup to the U.S.
LetkoBrosseau Report-https://www.lba.ca/wp-content/uploads/2019/05/en-Macro_EM-Investing-Fast-growing-emerging-markets-offer-long-term-opportunities-March-2019_.pdf
S&P 500 (SPY) 312 or the 10 day moving average is pivotal price resistance; 303.50 is major support.
Russell 2000 (IWM) 160.35 is the price support to hold and a move over 162 should help the bulls.
Dow Jones Industrials (DIA) 279.00 is pivotal price resistance and 272.50 is support.
Nasdaq (QQQ) 203.25 or the 10 day moving average is pivotal price resistance, while 196.41 is underlying support.
KRE (Regional Banks) 56.00 pivotal 57.50 is major price resistance.
SMH (Semiconductors) 130.60 needs to hold with 132.10 or the 10 day moving average being pivotal price resistance.
IYT (Transportation) 188.25 is key price support. And if fails, will impact everything. Price resistance is at 193.45
IBB (Biotechnology) 116.30 is key price support; 122.97 is the 2018 high.
XRT (Retail) 44.15 is price resistance and 43-43.35 key price support.
Twitter: @marketminute
The author may have a position in the mentioned securities at the time of publication. Any opinions expressed herein are solely those of the author, and do not in any way represent the views or opinions of any other person or entity.


